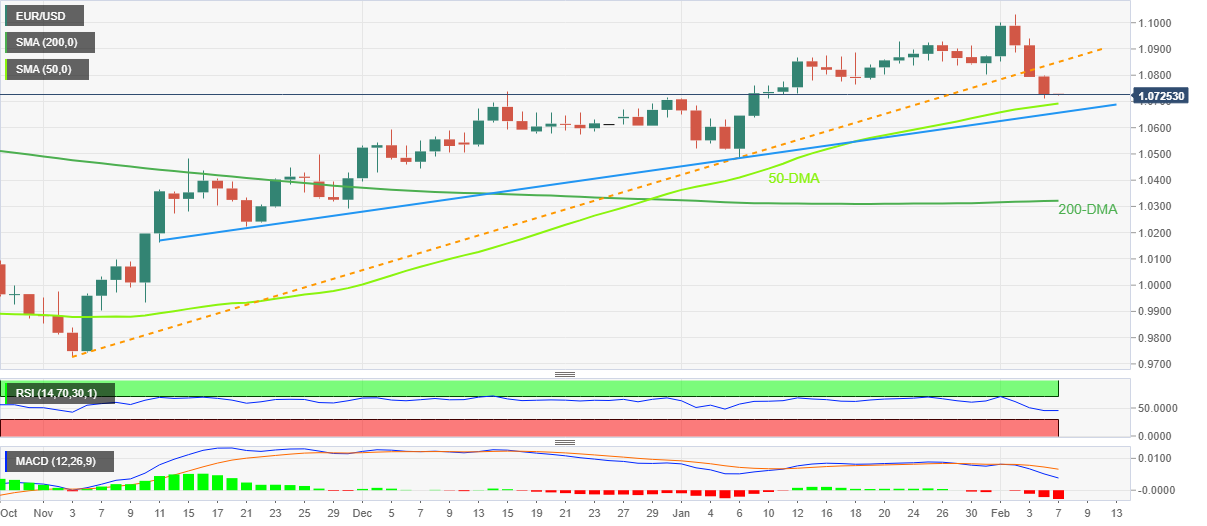
EUR/USD Price Analysis: Stays pressured towards 50-DMA support


  • EUR/USD holds lower grounds at one-month bottom, steadies after three-day downtrend.
  • Downbeat MACD signals, RSI (14) join trend line breakdown to favor sellers.
  • Three-month-old ascending trend line adds to the downside filters.
  • Buyers need validation from 1.0930 to retake control.


EUR/USD licks its wounds at the lowest levels in a month, depressed around 1.0725 during early Tuesday in Asia. That said, the major currency pair dropped during the last consecutive three days.

Not only the three-day downtrend but the quote’s sustained downside break of an ascending trend line from early November join the bearish MACD signals and the downbeat RSI (14), not oversold, to keep sellers hopeful.

As a result, the EUR/USD pair’s further downside towards the 50-DMA, around 1.0690, appears imminent.

However, a three-month-long upward-sloping trend line, close to 1.0655 could challenge the EUR/USD bears afterward.

In a case where the EUR/USD pairs remain bearish past 1.0655, the previous monthly low near 1.0480 and the 200-DMA level surrounding 1.0320 will gain the market’s attention.

Alternatively, recovery remains elusive unless the quote stays below the support-turned-resistance line, around 1.0850.

Even so, multiple tops marked around 1.0930 appears more important as the validation point for the EUR/USD buyers.

Following that, a run-up towards the 1.1000 psychological magnet and then refreshing the monthly high, currently around 1.1030, can’t be ruled out.

Overall, EUR/USD is likely to remain bearish with the 50-DMA and ascending trend line from November 11 acting as immediate support to watch.

EUR/USD: Daily chart

Trend: Further downside expected

Additional important levels

Overview
Today last price 1.0726
Today Daily Change -0.0067
Today Daily Change % -0.62%
Today daily open 1.0793
 
Trends
Daily SMA20 1.0842
Daily SMA50 1.0677
Daily SMA100 1.032
Daily SMA200 1.0319
 
Levels
Previous Daily High 1.094
Previous Daily Low 1.0793
Previous Weekly High 1.1033
Previous Weekly Low 1.0793
Previous Monthly High 1.093
Previous Monthly Low 1.0483
Daily Fibonacci 38.2% 1.0849
Daily Fibonacci 61.8% 1.0884
Daily Pivot Point S1 1.0744
Daily Pivot Point S2 1.0695
Daily Pivot Point S3 1.0597
Daily Pivot Point R1 1.0891
Daily Pivot Point R2 1.0989
Daily Pivot Point R3 1.1038


Share: Feed news

Information on these pages contains forward-looking statements that involve risks and uncertainties. Markets and instruments profiled on this page are for informational purposes only and should not in any way come across as a recommendation to buy or sell in these assets. You should do your own thorough research before making any investment decisions. FXStreet does not in any way guarantee that this information is free from mistakes, errors, or material misstatements. It also does not guarantee that this information is of a timely nature. Investing in Open Markets involves a great deal of risk, including the loss of all or a portion of your investment, as well as emotional distress. All risks, losses and costs associated with investing, including total loss of principal, are your responsibility. The views and opinions expressed in this article are those of the authors and do not necessarily reflect the official policy or position of FXStreet nor its advertisers. The author will not be held responsible for information that is found at the end of links posted on this page.

If not otherwise explicitly mentioned in the body of the article, at the time of writing, the author has no position in any stock mentioned in this article and no business relationship with any company mentioned. The author has not received compensation for writing this article, other than from FXStreet.

FXStreet and the author do not provide personalized recommendations. The author makes no representations as to the accuracy, completeness, or suitability of this information. FXStreet and the author will not be liable for any errors, omissions or any losses, injuries or damages arising from this information and its display or use. Errors and omissions excepted.

The author and FXStreet are not registered investment advisors and nothing in this article is intended to be investment advice.

Recommended content


Recommended content

Editors’ Picks

AUD/USD hovers around 0.6500 amid light trading, ahead of US GDP

AUD/USD hovers around 0.6500 amid light trading, ahead of US GDP

AUD/USD is trading close to 0.6500 in Asian trading on Thursday, lacking a clear directional impetus amid an Anzac Day holiday in Australia. Meanwhile, traders stay cautious due ti risk-aversion and ahead of the key US Q1 GDP release. 

AUD/USD News

USD/JPY finds its highest bids since 1990, near 155.50

USD/JPY finds its highest bids since 1990, near 155.50

USD/JPY keeps breaking into its highest chart territory since June of 1990 early Thursday, testing 155.50 for the first time in 34 years as the Japanese Yen remains vulnerable, despite looming Japanese intervention risks. Focus shifts to Thursday's US GDP report and the BoJ decision on Friday. 

USD/JPY News

Gold price treads water near $2,320, awaits US GDP data

Gold price treads water near $2,320, awaits US GDP data

Gold price recovers losses but keeps its range near $2,320 early Thursday. Renewed weakness in the US Dollar and the US Treasury yields allow Gold buyers to breathe a sigh of relief. Gold price stays vulnerable amid Middle East de-escalation, awaiting US Q1 GDP data. 

Gold News

Injective price weakness persists despite over 5.9 million INJ tokens burned

Injective price weakness persists despite over 5.9 million INJ tokens burned

Injective price is trading with a bearish bias, stuck in the lower section of the market range. The bearish outlook abounds despite the network's deflationary efforts to pump the price. Coupled with broader market gloom, INJ token’s doomed days may not be over yet.

Read more

Meta Platforms Earnings: META sinks 10% on lower Q2 revenue guidance Premium

Meta Platforms Earnings: META sinks 10% on lower Q2 revenue guidance

This must be "opposites" week. While Doppelganger Tesla rode horrible misses on Tuesday to a double-digit rally, Meta Platforms produced impressive beats above Wall Street consensus after the close on Wednesday, only to watch the share price collapse by nearly 10%.

Read more

Forex MAJORS

Cryptocurrencies

Signatures