|

EUR/USD Price Analysis: Stays directed towards 1.1230 inside weekly falling channel

  • EUR/USD remains pressured within short-term bearish chart pattern.
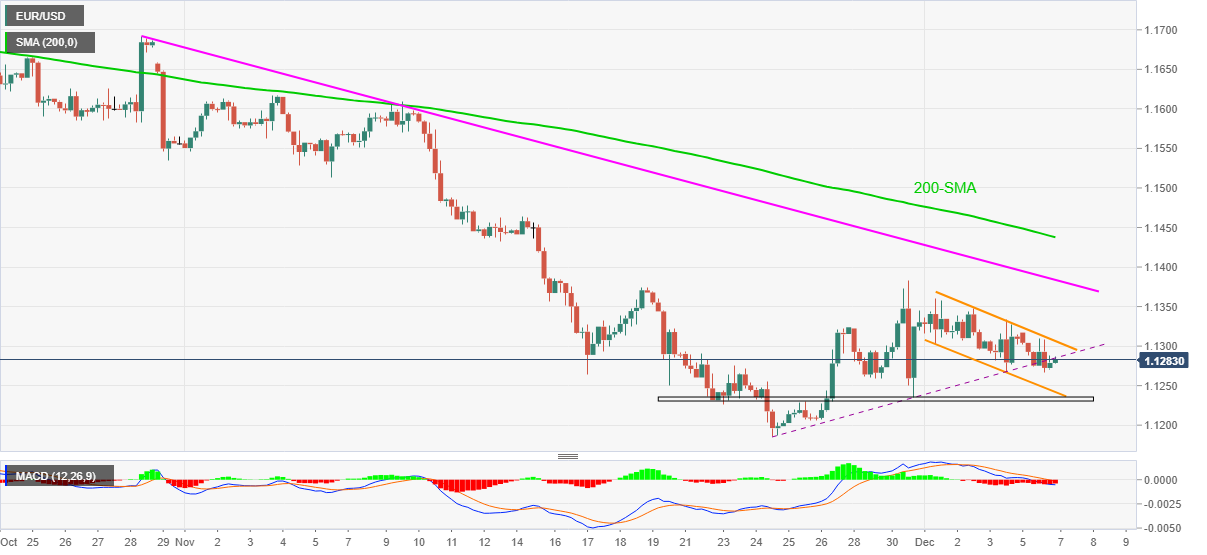
  • Downbeat MACD signals, break of two-week-old previous support adds to the bearish bias.
  • Horizontal area from November 22 offers immediate support, descending trend line from late October, 200-SMA add to the upside filters.

EUR/USD struggles to keep the latest rebound from 1.1266 around the support-turned-resistance line during the initial Asian session on Tuesday. That said, the major currency pair stays inside a nearby descending trend channel formation around 1.1285 by the press time.

In addition to the quote’s downside break of a short-term support line, now resistance, as well as a falling channel formation, bearish MACD signal also keep EUR/USD sellers hopeful.

The current weakness, however, may take a breather around a fortnight-long horizontal zone surrounding 1.1235-30 before directing the EUR/USD bears to the yearly low near 1.1186.

Given the pair’s declines past 1.1186, June 2020 low near 1.1170 and March 2020 peak of 1.1147 will be in focus.

Alternatively, the stated channel’s resistance line around 1.1310 guards short-term advances of the EUR/USD pair.

On a clear break of 1.1310, a descending resistance line from October 28 and 200-SMA, respectively near 1.1385 and 1.1440, will be crucial hurdles to follow for witnessing a change in the current bearish trend.

EUR/USD: Four-hour chart

Trend: Further weakness expected

Additional important levels

Overview
Today last price1.1283
Today Daily Change-0.0026
Today Daily Change %-0.23%
Today daily open1.1309
 
Trends
Daily SMA201.1349
Daily SMA501.1501
Daily SMA1001.1643
Daily SMA2001.1817
 
Levels
Previous Daily High1.1334
Previous Daily Low1.1267
Previous Weekly High1.1383
Previous Weekly Low1.1235
Previous Monthly High1.1616
Previous Monthly Low1.1186
Daily Fibonacci 38.2%1.1308
Daily Fibonacci 61.8%1.1292
Daily Pivot Point S11.1273
Daily Pivot Point S21.1236
Daily Pivot Point S31.1206
Daily Pivot Point R11.134
Daily Pivot Point R21.137
Daily Pivot Point R31.1407

Author

Anil Panchal

Anil Panchal

FXStreet

Anil Panchal has nearly 15 years of experience in tracking financial markets. With a keen interest in macroeconomics, Anil aptly tracks global news/updates and stays well-informed about the global financial moves and their implications.

More from Anil Panchal
Share:

Editor's Picks

EUR/USD holds above 1.1750 after mixed EU PMI data

EUR/USD manages to hold above 1.1750 but struggles to gather recovery momentum on Friday, following the mixed February PMI figures from Germany and the Eurozone. In the second half of the day, Q4 GDP, December inflation and February PMI data from the US will be watched closely by market participants.

GBP/USD recovers further toward 1.3500 after UK PMI data

GBP/USD is recovering ground further toward 1.3500 in European trading on Friday, helped by a modest uptick in the Pound Sterling after stronger-than-expected UK January Retail Sales and February PMI data. However, the pair's further upside could be limited amid persistent US Dollar strength as the focus turns to key US data. 

Gold sticks to positive bias above $5,000 ahead of US data

Gold gains some positive traction for the third consecutive day on Friday. holding above $5,000. Traders now look forward to the key US macro releases – the Advance Q4 GDP report and the Personal Consumption Expenditures (PCE) Price Index – for fresh trading impetus. 

US GDP growth expected to slow down significantly in Q4 after stellar Q3 

The United States Bureau of Economic Analysis will publish the first preliminary estimate of the fourth-quarter Gross Domestic Product at 13:30 GMT. Analysts forecast the US economy to have expanded at a 3% annualized rate, slowing down from the 4.4% growth posted in the previous quarter.

Iran tensions and AI fears at the forefront ahead of key US data

Thursday’s scorecard shows major US Stock benchmarks closed modestly in the red amid mounting US-Iran tensions and AI disruption worries. The S&P 500 shed 19 points (0.3%) to 6,861, the Nasdaq 100 lost 101 points (0.4%) to 24,797, and the Dow Jones Industrial Average dropped 267 points (0.5%) to 49,395.

Official Trump price approaches breakout with mixed signals from traders

Official Trump (TRUMP) is trading at $3.50 at the time of writing, approaching its upper consolidation range. A breakout from this range could open the door for an upside move. On-chain data shows market indecision, with balanced flows between bulls and bears, signaling a lack of clear directional bias.