|

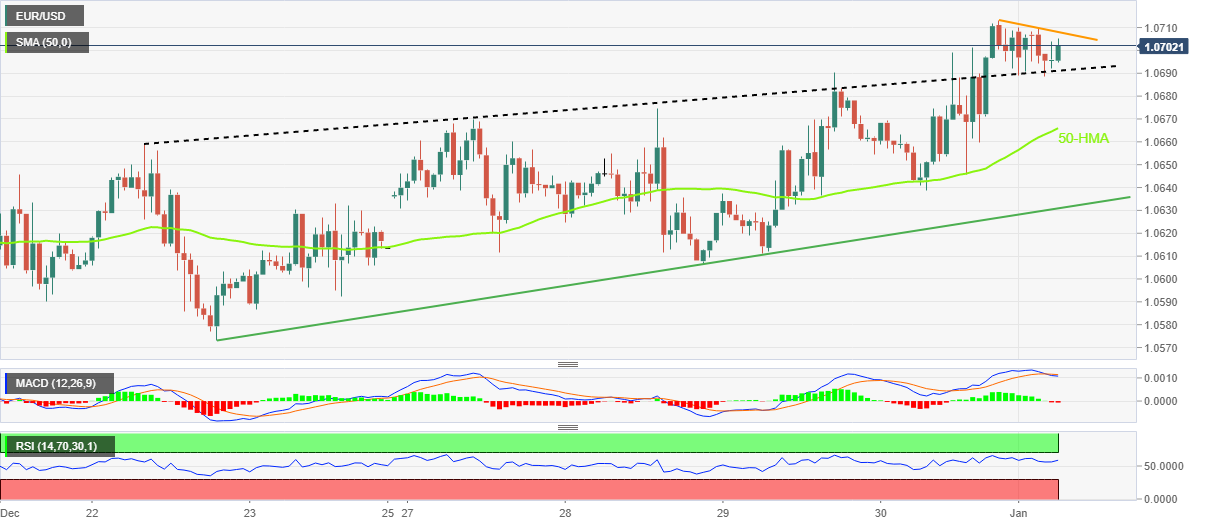
EUR/USD Price Analysis: Stays defensive above 1.0690 resistance-turned-support

  • EUR/USD seesaws near seven-month high, snaps two-day winning streak.
  • One-week-old previous resistance puts a floor under the prices even as buyers appear to run out of steam.
  • 50-HMA, ascending trend line from December 22 act as additional downside filters.

EUR/USD portrays exhaustion of the previous bull-run amid Monday’s holiday-inspired lackluster trading day.

Also read: EUR/USD portrays tepid start to 2023 after a volatile year, ECB vs. Fed talks, US NFP eyed

In doing so, the major currency pair fades the previous day’s upside break of the one-week-old resistance line, now support.

The EUR/USD pair’s retreat also takes clues from the bearish MACD signals and steady RSI, adding strength to the bearish bias.

However, a clear downside break of 1.0690 becomes necessary for the major currency pair to recall the bears.

Even so, 50-HMA and an upward-sloping support line from December 22, respectively near 1.0665 and 1.0630, could restrict the quote’s further downside.

In a case where the EUR/USD price remains weak past 1.0630, the late December swing low near 1.0570 could lure the pair bears.

Alternatively, buyers need validation from the immediate resistance line, as well as the monthly, respectively around 1.0708 and 1.0713, to direct prices towards May 2022 peak surrounding 1.0785.

Following that, the 1.0800 could probe the EUR/USD bulls before highlighting the late April 2022 swing high of 1.0936 as the key hurdle to the north.

Overall, EUR/USD remains on the buyer’s radar but a short-term pullback appears to brew of late.

EUR/USD: Hourly chart

Trend: Downside expected

Additional important levels

Overview
Today last price1.0702
Today Daily Change-0.0004
Today Daily Change %-0.04%
Today daily open1.0706
 
Trends
Daily SMA201.0595
Daily SMA501.0347
Daily SMA1001.0126
Daily SMA2001.0325
 
Levels
Previous Daily High1.0713
Previous Daily Low1.0639
Previous Weekly High1.0713
Previous Weekly Low1.0607
Previous Monthly High1.0736
Previous Monthly Low1.0393
Daily Fibonacci 38.2%1.0685
Daily Fibonacci 61.8%1.0667
Daily Pivot Point S11.0658
Daily Pivot Point S21.0611
Daily Pivot Point S31.0584
Daily Pivot Point R11.0733
Daily Pivot Point R21.076
Daily Pivot Point R31.0808

Author

Anil Panchal

Anil Panchal

FXStreet

Anil Panchal has nearly 15 years of experience in tracking financial markets. With a keen interest in macroeconomics, Anil aptly tracks global news/updates and stays well-informed about the global financial moves and their implications.

More from Anil Panchal
Share:

Editor's Picks

AUD/USD falls to near 0.7100 after slipping below 50-day EMA

AUD/USD depreciates after registering minor gains in the previous day, trading around 0.7120 during the Asian hours. The technical analysis of the daily chart shows the pair consolidating sideways within a rectangle pattern, as neither bulls nor bears gain control. The AUD/USD pair is holding a slight bearish tone however as it sits beneath both the nine-day and 50-day EMAs.

160.00: USD/JPY back near intervention territory after upbeat US jobs report

US Nonfarm Payrolls beat expectations by a wide margin in May, with 172K jobs added. The US Dollar rebounds after the release, helping USD/JPY recover from its intraday lows. Warnings from Japanese authorities continue to limit upside potential near the 160.00 threshold.

Gold targets $4,300 amid stronger Dollar

Gold faces increasing selling interest and navigates the area of three-month lows near the $4,300 mark per troy ounce on Friday. The precious metal’s decline comes as traders assess the stronger-than-expected NFP, while the bid bias in the Greenback and higher US Treasury yields also collaborate with the retracement.

Cardano hits five-year low even as Hoskinson clarifies "break" isn't an exit

Cardano (ADA) price is down 10% at press time on Friday, extending losses over 30% so far this week amid Charles Hoskinson's clarification that "break" isn't an exit.

Week ahead – Fed countdown begins amid US inflation data and geopolitical risks

Fed Chair Warsh’s first meeting approaches as key US inflation data could reshape expectations. Oil prices remain elevated as US-Iran talks continue; tariffs also return to the spotlight. ECB is expected to hike; will it be a one-off move or is July live?

The US economy defies the rules: 100 days into the Oil shock and the recession signal is still missing

More than three months after the start of the Iran war and the resulting disruption to global energy markets, the US economy continues to display remarkable resilience. The conflict has triggered a sharp rise in Oil prices, reignited inflationary pressures and fueled widespread concerns about a potential economic slowdown.