EUR/USD Price Analysis: Rises toward 1.1000 ahead of three-month highs
- EUR/USD may extend its upside as the daily chart analysis shows a bullish inclination.
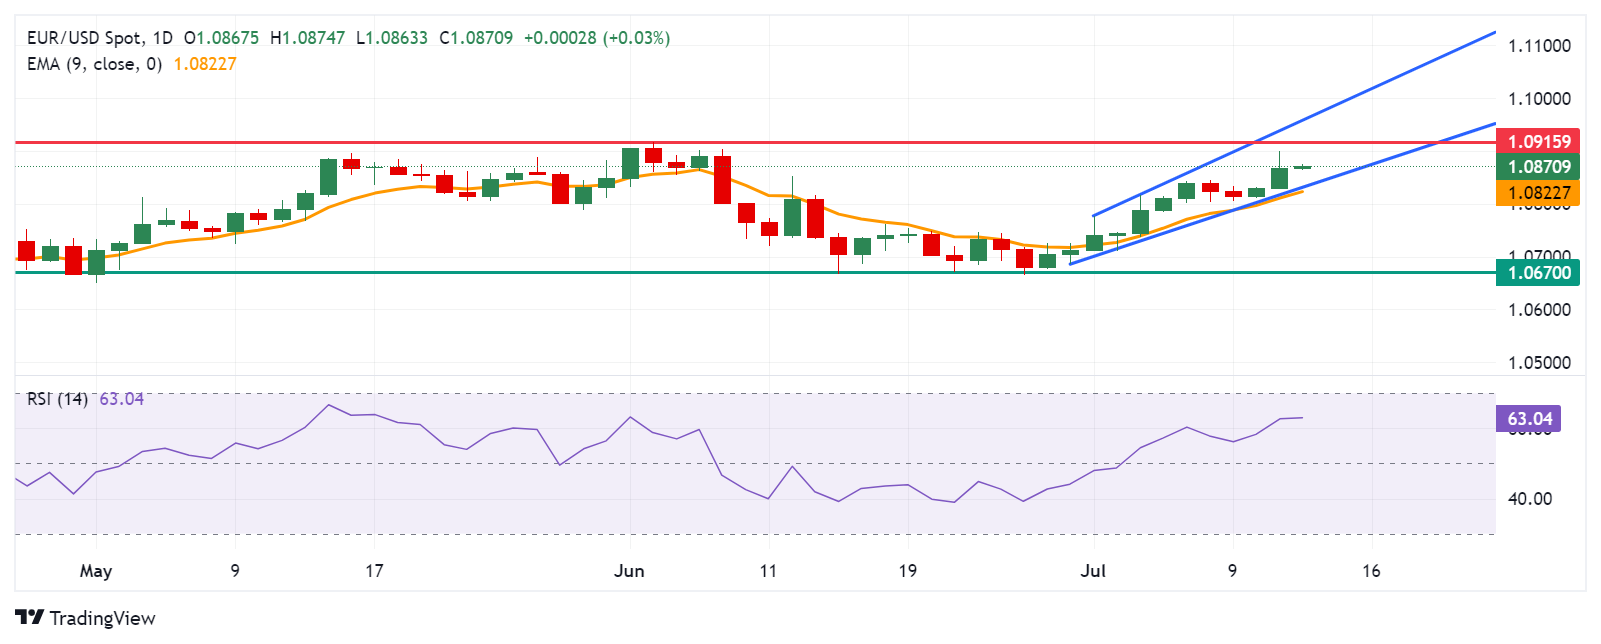
- The pair may face a potential resistance near a three-month high at 1.0915.
- The lower boundary of the ascending channel around 1.0830 level could act as immediate support.

EUR/USD continues its winning streak for the third successive day, trading around 1.0870 during the Asian hours on Friday. The EUR/USD pair found support as the US Dollar (USD) weakened following softer-than-expected US Consumer Price Index (CPI) data in June. This has increased expectations of a potential Federal Reserve (Fed) rate cut in September.
The technical analysis of the daily chart shows a bullish inclination, with the pair moving within an ascending channel. Furthermore, the 14-day Relative Strength Index (RSI), a momentum indicator, is above the level of 50, confirming the bullish trend for the EUR/USD pair. Continued upward movement could reinforce the pair's bullish bias.
The EUR/USD pair faces potential resistance near a three-month high at 1.0915. Further barrier appears around the upper boundary of the ascending channel around 1.0960. A breakthrough above this level could lead the pair to explore the region around the psychological level of 1.1000.
On the downside, initial support for EUR/USD lies near the lower boundary of the ascending channel around the 1.0830 level, followed by the nine-day Exponential Moving Average (EMA) at the level of 1.0822.
A breach below the latter might increase downward pressure, targeting support around the key level of 1.0670, potentially serving as a rebound support level.
EUR/USD: Daily Chart
Euro PRICE Today
The table below shows the percentage change of Euro (EUR) against listed major currencies today. Euro was the strongest against the Japanese Yen.
| USD | EUR | GBP | JPY | CAD | AUD | NZD | CHF | |
|---|---|---|---|---|---|---|---|---|
| USD | -0.03% | 0.01% | 0.11% | -0.08% | -0.14% | -0.10% | -0.03% | |
| EUR | 0.03% | 0.04% | 0.19% | -0.06% | -0.12% | -0.08% | -0.03% | |
| GBP | -0.01% | -0.04% | 0.14% | -0.11% | -0.17% | -0.13% | -0.07% | |
| JPY | -0.11% | -0.19% | -0.14% | -0.26% | -0.28% | -0.26% | -0.19% | |
| CAD | 0.08% | 0.06% | 0.11% | 0.26% | -0.05% | -0.02% | 0.03% | |
| AUD | 0.14% | 0.12% | 0.17% | 0.28% | 0.05% | 0.04% | 0.10% | |
| NZD | 0.10% | 0.08% | 0.13% | 0.26% | 0.02% | -0.04% | 0.07% | |
| CHF | 0.03% | 0.03% | 0.07% | 0.19% | -0.03% | -0.10% | -0.07% |
The heat map shows percentage changes of major currencies against each other. The base currency is picked from the left column, while the quote currency is picked from the top row. For example, if you pick the Euro from the left column and move along the horizontal line to the US Dollar, the percentage change displayed in the box will represent EUR (base)/USD (quote).
Author

Akhtar Faruqui
FXStreet
Akhtar Faruqui is a Forex Analyst based in New Delhi, India. With a keen eye for market trends and a passion for dissecting complex financial dynamics, he is dedicated to delivering accurate and insightful Forex news and analysis.