|

EUR/USD Price Analysis: Recovery rally gathers pace

  • EUR/USD printed its biggest single-day gain in over a month on Tuesday. 
  • The daily chart now favors a continued rally to former support-turned-hurdle at 1.1785.

While EUR/USD's recovery rally is gathering pace, the pair remains on track to post its first monthly loss since May. 

The pair jumped by 0.67% on Tuesday, its biggest single-day gain since Aug. 28. More importantly, it formed a green marubozu candle, as buyers remained in control from day's open to close. 

The marubozu indicates that bullish sentiment is quite strong. Also, it confirmed the reversal higher signaled by Monday's bullish inside day candlestick pattern. 

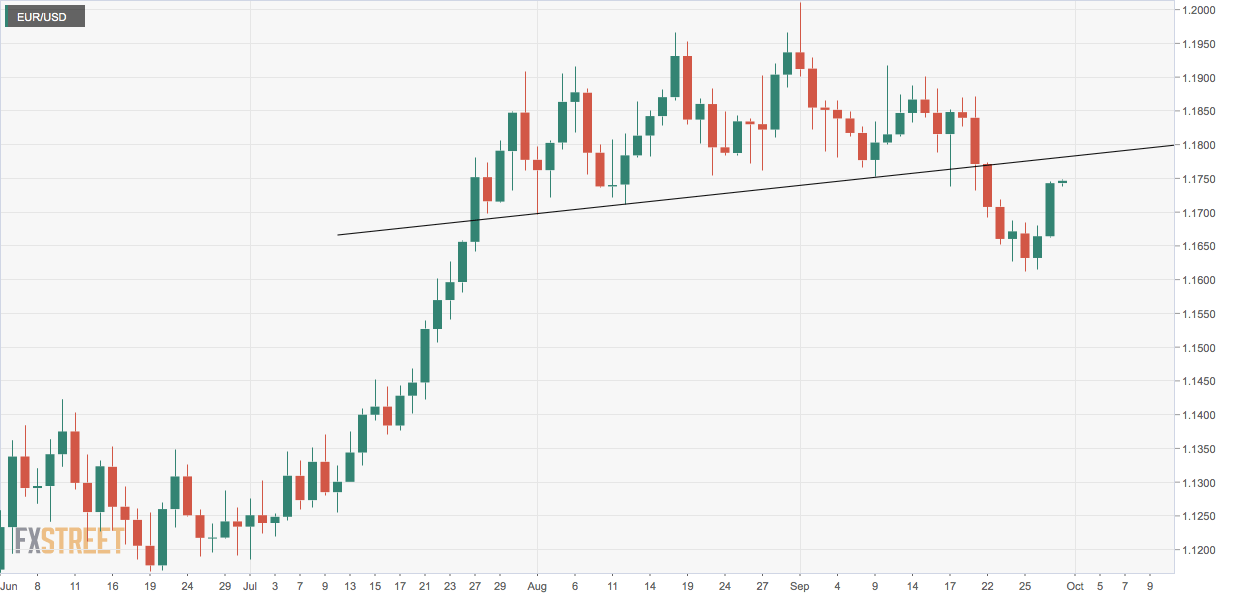
As such, EUR/USD could test the former support-turned-resistance of the head-and-shoulders neckline at 1.1785. 

At press time, EUR/USD is trading at 1.1747. Even if the pair rallies to 1.1785 as suggested by technical charts, still it would end the month with at least a 1% loss. Tuesday's low of 1.16608 is the level to beat for the selles. 

Daily chart

Trend: Bullish

Technical levels

EUR/USD

Overview
Today last price1.1746
Today Daily Change0.0003
Today Daily Change %0.03
Today daily open1.1743
 
Trends
Daily SMA201.1784
Daily SMA501.1794
Daily SMA1001.1497
Daily SMA2001.1243
 
Levels
Previous Daily High1.1746
Previous Daily Low1.1662
Previous Weekly High1.1872
Previous Weekly Low1.1612
Previous Monthly High1.1966
Previous Monthly Low1.1696
Daily Fibonacci 38.2%1.1714
Daily Fibonacci 61.8%1.1694
Daily Pivot Point S11.1688
Daily Pivot Point S21.1633
Daily Pivot Point S31.1604
Daily Pivot Point R11.1772
Daily Pivot Point R21.18
Daily Pivot Point R31.1855

Author

Omkar Godbole

Omkar Godbole

FXStreet Contributor

Omkar Godbole, editor and analyst, joined FXStreet after four years as a research analyst at several Indian brokerage companies.

More from Omkar Godbole
Share:

Editor's Picks

EUR/USD stays well offered below 1.1800

The selling pressure on EUR/USD is picking up pace, with the pair slipping decisively below the key 1.1800 level and sliding to fresh two week lows as Wednesday’s session draws to a close. The move lower comes as the US Dollar finds renewed strength after the latest round of US data and the release of the FOMC Minutes. Next of note on the docket will be the US weekly Initial Jobless Claims.
 

GBP/USD reaches multi-day lows near 1.3500

GBP/USD reverses its initial upside momentum and is now adding to previous declines, approaching the 1.3500 region on Wednesday. Cable’s downtick comes on the back of decent gains in the Greenback and easing UK inflation figures, which seem to have reinforced the case for a BoE rate cut in March.

Gold battle to regain $5,000 continues

Gold is back on the front foot on Wednesday, shaking off part of the early week softness and challenging two-day highs near the $5,000 mark per troy ounce. The move comes ahead of the FOMC Minutes and is unfolding despite an intense rebound in the US Dollar.

Bitcoin has found or is near a bottom, extended consolidation to follow: K33

Bitcoin (BTC) is nearing or has already established a bottom, which could be followed by a sustained period of slow price movement, according to K33.

Mixed UK inflation data no gamechanger for the Bank of England

Food inflation plunged in January, but service sector price pressure is proving stickier. We continue to expect Bank of England rate cuts in March and June. The latest UK inflation read is a mixed bag for the Bank of England, but we doubt it drastically changes the odds of a March rate cut.

Sui extends sideways action ahead of Grayscale’s GSUI ETF launch

Sui is extending its downtrend for the second consecutive day, trading at 0.95 at the time of writing on Wednesday. The Layer-1 token is down over 16% in February and approximately 34% from the start of the year, aligning with the overall bearish sentiment across the crypto market.