|

EUR/USD Price Analysis: Recovery needs validation from 1.0910 hurdle, mid-tier EU catalysts and yields

  • EUR/USD picks up bids to refresh intraday high, bounces off six-week low.
  • Pullback in Treasury bond yields, light calendar allow Euro bears to take a breather.
  • Final prints of Eurozone inflation, ECB’s Lane eyed for clear directions.
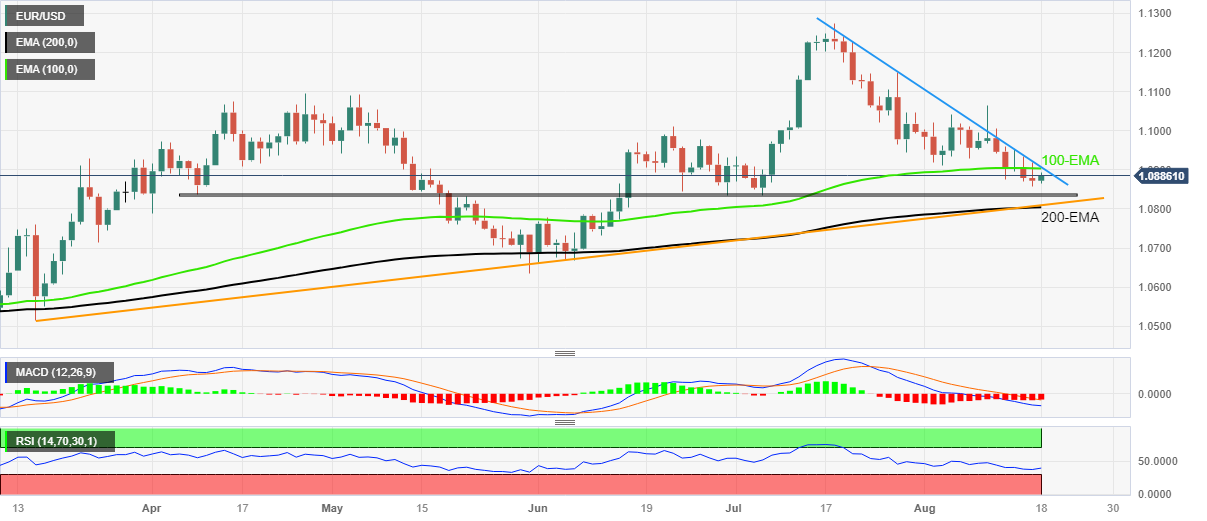
  • Convergence of 100-EMA, one-month-old descending trend line prods Euro buyers.

EUR/USD consolidates weekly losses by bouncing off a 1.5-month low to print the first daily gain in three. In doing so, the Euro pair benefits from the US Dollar’s retreat, amid a pullback in the Treasury bond yields, during the early hours of Friday. It’s worth noting a rebound in the RSI (14) line from the nearly oversold conditions also underpins the major currency pair’s latest rebound.

Even so, comparatively better US data and the looming recession risk for Germany join the sour sentiment to keep the Euro buyers in check ahead of the second-tier Eurozone data/events. Among them, the final readings of Eurozone inflation for July and a speech from the European Central Bank (ECB) Chief Economist Philip Lane will be crucial to follow.

Technically, a convergence of the 100-day Exponential Moving Average (EMA) joins a downward-sloping trend line from July 18 to highlight the 1.0910 as a strong upside hurdle for the EUR/USD bulls to cross to retake control. Additionally, the bearish MACD signals also challenge the Euro pair’s upside hopes.

In a case where the EUR/USD manages to cross the 1.0910 resistance confluence, the odds of witnessing a rally towards the 1.1000 psychological magnet and then to June’s top surrounding 1.1015 can’t be ruled out.

On the flip side, a four-month-old horizontal support zone near 1.0840-35 appears an immediate challenge for the EUR/USD sellers.

Following that, a convergence of the 200-day EMA and an upward-sloping trend line from March, close to 1.0800 at the latest, will be a tough nut to crack for the EUR/USD bears.

EUR/USD: Daily chart
Trend: Pullback expected

Additional important levels

Overview
Today last price1.089
Today Daily Change0.0018
Today Daily Change %0.17%
Today daily open1.0872
 
Trends
Daily SMA201.0981
Daily SMA501.0975
Daily SMA1001.0931
Daily SMA2001.0789
 
Levels
Previous Daily High1.0918
Previous Daily Low1.0856
Previous Weekly High1.1065
Previous Weekly Low1.0929
Previous Monthly High1.1276
Previous Monthly Low1.0834
Daily Fibonacci 38.2%1.088
Daily Fibonacci 61.8%1.0895
Daily Pivot Point S11.0846
Daily Pivot Point S21.0821
Daily Pivot Point S31.0785
Daily Pivot Point R11.0908
Daily Pivot Point R21.0944
Daily Pivot Point R31.097

Author

Anil Panchal

Anil Panchal

FXStreet

Anil Panchal has nearly 15 years of experience in tracking financial markets. With a keen interest in macroeconomics, Anil aptly tracks global news/updates and stays well-informed about the global financial moves and their implications.


More from Anil Panchal
Share:

Editor's Picks

AUD/USD: Next on the upside is 0.7000

AUD/USD leaves behind Monday’s downtick and trades with marked gains, approaching the critical 0.7000 yardstick ahead of the opening bell in Asia on Wednesday. The pair’s solid performance follows the Greenback’s fresh downward trend amid cooling geopolitical tensions and caution ahead of the US CPI data.

USD/JPY extends retreat below 158.50 as intervention risks loom

USD/JPY is dropping below 158.50 in the Asian session on Tuesday, snapping a two-day winning streak and pulling back from an over two-week top touched the previous day, despite Japan's soft PPI inflation print. Bulls turn cautious amid speculation that authorities will step in to prop up the Japanese Yen, which, in turn, weighs on the pair.

Gold: Bears struggle to breach below $4,150

Gold now gives away its initial gains and resumes its decline, revisiting the $4,160 region per troy ounce on Tuesday. The precious metal’s pullback comes despite the fresh downward trend in the Greenback in combination with a mixed performance of US Treasury yields across the board and easing tensions on the geopolitical front.

HYPE falls to $80 as ETF outflows and flat volume weigh on Hyperliquid
Hyperliquid (HYPE) declines 4% on Tuesday, briefly touching $80 as perpetual volumes stay flat and institutional interest decreases. Perpetual volume on the platform saw a modest increase last week from $41.5 billion to $42.5 billion. The metric matters because 99% of fees Hyperliquid captures from trading volume flow toward token buybacks.
S&P 500 earnings just hit a record. The AI data centre bill hasn't landed yet
S&P 500 companies are on track for a third straight quarter of earnings growth above 25%, according to FactSet. Their profit margin hit 17% in the April-June quarter, the highest in FactSet data going back to 2009. The cash behind those earnings has been shrinking for two years, and almost all of the shrinkage is in the handful of companies building data centres for artificial intelligence (AI).
Has Bitcoin really escaped the macro forces it was built to fight?
Over 17 years ago, Satoshi Nakamoto designed Bitcoin (BTC) on the back of a global financial crisis as an alternative to the global monetary system outside the control of central banks, governments and traditional intermediaries. This raises a key question: has Bitcoin really become independent of the macroeconomic forces it was built to challenge?