|

EUR/USD Price Analysis: Range bound within 1.0100-1.0260 since July 22

  • The EUR/USD is set to finish the week almost flat, gaining 0.05%.
  • The shared currency daily chart is neutral-to-downwards, but the hourly is neutral-to-upwards.
  • EUR/USD Price Analysis: A daily close above 1.0200 could pave the way towards 1.0300; otherwise, it might drop towards 1.0096.

The EUR/USD is trading at 1.0220, after hitting a daily high at 1.0254, but later tumbled towards the daily low at 1.0145 on elevated US inflation data. In June, the Personal Consumption Expenditures (PCE) rose by 6.8% YoY, fueling expectations of additional Federal Reserve rate hikes, despite the market's pricing in only 80 bps of tightening.

EUR/USD Price Analysis: Technical outlook

From a daily chart perspective, the EUR/USD remains neutral-to-downward biased, helped by the 20-day EMA lying below the exchange rate at 1.0167. Nevertheless, the EUR/USD, unable to capitalize on an upbeat market mood, and broad US dollar weakness, keeps the shared currency exposed to further selling pressure. If EUR/USD buyers want to shift the bias to neutral, they must reclaim the May 13 low-turned-resistance at 1.0348. Once cleared, a challenge of the 50-day EMA at 1.0423 is on the cards. On the other hand, if EUR/USD sellers achieve a daily close below 1.0200, that would pave the road towards 1.0096.

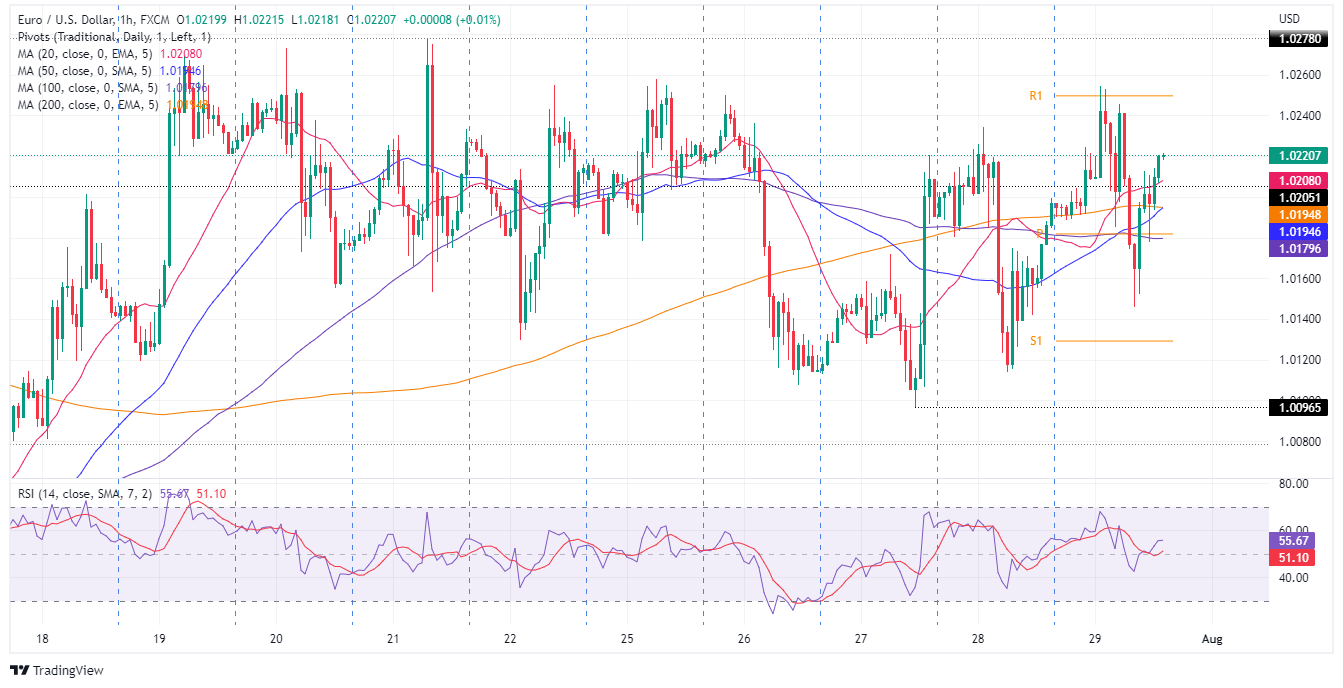
EUR/USD 1-hour chart

In the near term, the EUR/USD hourly chart depicts a sideways picture in the major. Since July 19, the EUR/USD has been trading in the 1.0096-1.0278 range, unable to break either side of the trading range, but EUR/USD traders should notice that the hourly EMAs sit below the spot price, signaling that buying pressure might be building.

Therefore, the EUR/USD first resistance would be the R1 daily pivot at 1.0250. Once cleared, the next resistance would be 1.0278, followed by 1.0300. On the flip side, the EUR/USD first support would be the 20-hour EMA at 1.0206. Break below will expose the confluence of the 200 and 50-hours EMAs at around 1.0192-94, followed by the 100-hour EMA at 1.0179.

EUR/USD Key Technical Levels

EUR/USD

Overview
Today last price1.0220
Today Daily Change0.0022
Today Daily Change %0.22
Today daily open1.0198
 
Trends
Daily SMA201.0181
Daily SMA501.0434
Daily SMA1001.061
Daily SMA2001.0971
 
Levels
Previous Daily High1.0234
Previous Daily Low1.0114
Previous Weekly High1.0278
Previous Weekly Low1.0078
Previous Monthly High1.0774
Previous Monthly Low1.0359
Daily Fibonacci 38.2%1.016
Daily Fibonacci 61.8%1.0189
Daily Pivot Point S11.013
Daily Pivot Point S21.0062
Daily Pivot Point S31.0009
Daily Pivot Point R11.025
Daily Pivot Point R21.0302
Daily Pivot Point R31.037

Author

Christian Borjon Valencia

Markets analyst, news editor, and trading instructor with over 14 years of experience across FX, commodities, US equity indices, and global macro markets.

More from Christian Borjon Valencia
Share:

Editor's Picks

EUR/USD trims losses, back to 1.1830

EUR/USD manages to regain some composure, leaving behind part of the earlier losses and reclaim the 1.1830 region on Tuesday. In the meantime, the US Dollar’s upside impulse loses some momentum while investors remain cautious ahead of upcoming US data releases, including the FOMC Minutes.

GBP/USD bounces off lows, retargets 1.3550

After bottoming out just below the 1.3500 yardstick, GBP/USD now gathers some fresh bids and advances to the 1.3530-1.3540 band in the latter part of Tuesday’s session. Cable’s recovery comes as the Greenback surrenders part of its advance, although it keeps the bullish bias well in place for the day.

Gold remains offered below $5,000

Gold stays on the defensive on Tuesday, receding to the sub-$5,000 region per troy ounce on the back of the persistent move higher in the Greenback. The precious metal’s decline is also underpinned by the modest uptick in US Treasury yields across the spectrum.

Crypto Today: Bitcoin, Ethereum, XRP upside looks limited amid deteriorating retail demand

The cryptocurrency market extends weakness with major coins including Bitcoin (BTC), Ethereum (ETH) and Ripple (XRP) trading in sideways price action at the time of writing on Tuesday.

UK jobs market weakens, bolstering rate cut hopes

In the UK, the latest jobs report made for difficult reading. Nonetheless, this represents yet another reminder for the Bank of England that they need to act swiftly given the collapse in inflation expected over the coming months. 

Ripple slides to $1.45 as downside risks surge

Ripple edges lower at the time of writing on Tuesday, from the daily open of $1.48, as headwinds persist across the crypto market. A short-term support is emerging at $1.45, but a buildup of bearish positions could further weaken the derivatives market and prolong the correction.