|

EUR/USD Price Analysis: Picks up bids near 1.0550 inside weekly triangle

  • EUR/USD picks up bids inside a fortnight-old trading range, weekly symmetrical triangle.
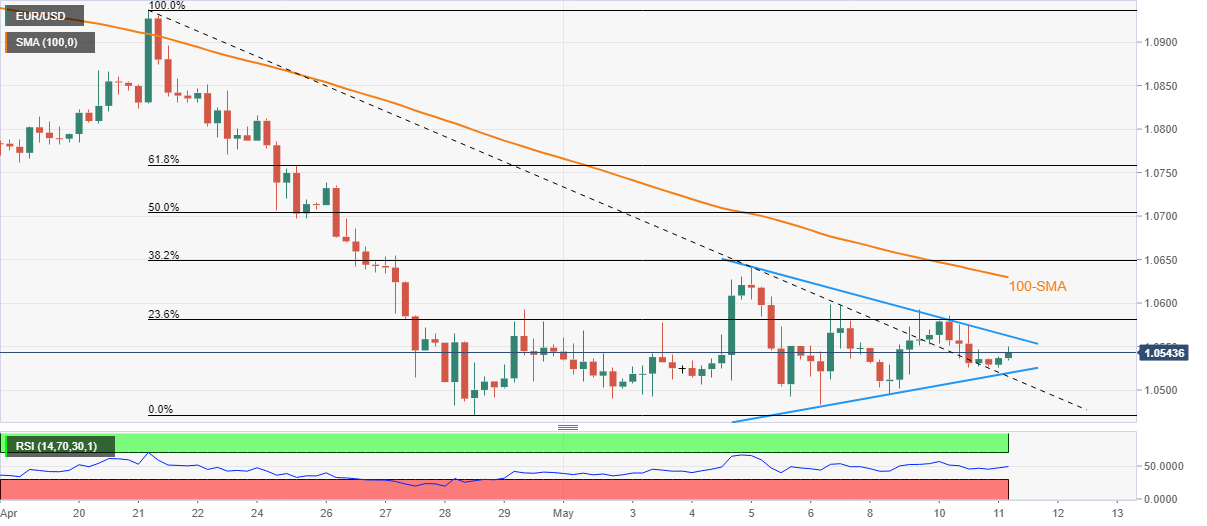
  • Clear break of three-week-old descending trend line, firmer RSI adds strength to the recovery moves.
  • 100-SMA offers an extra challenge to buyers before giving them control.

EUR/USD extends the early Asian session rebound towards poking the 1.0550 mark as European traders brace for Wednesday’s bell.

The major currency pair’s latest recovery could be linked to the U-turn from the previous resistance line stretched from April 21. Also keeping buyers hopeful is the recently firmer RSI (14) line.

It should be noted, however, that a one-week-long symmetrical triangle restricts short-term EUR/USD moves between 1.0565 and 1.0520.

Hence, the latest upside momentum eyes the triangle’s resistance line, namely around 1.0565, a break of which could direct buyers towards the 100-SMA level, near 1.0630 at the latest.

Even if the quote rises past 1.0630, the current month high around 1.0640-45 will act as an additional filter to the north before confirming the advances targeting the 1.0700 region.

On the contrary, a downside of the stated triangle’s support, around 1.0520, will be challenged by the resistance-turned-support line, close to 1.0515 at the latest.

Should the quote drop below 1.0515, the 1.0500 and April’s low near 1.0470 will lure the EUR/USD bears.

EUR/USD: Four-hour chart

Trend: Further recovery expected

Additional important levels

Overview
Today last price1.0545
Today Daily Change0.0017
Today Daily Change %0.16%
Today daily open1.0528
 
Trends
Daily SMA201.0668
Daily SMA501.0858
Daily SMA1001.1092
Daily SMA2001.1336
 
Levels
Previous Daily High1.0586
Previous Daily Low1.0526
Previous Weekly High1.0642
Previous Weekly Low1.0483
Previous Monthly High1.1076
Previous Monthly Low1.0471
Daily Fibonacci 38.2%1.0548
Daily Fibonacci 61.8%1.0563
Daily Pivot Point S11.0507
Daily Pivot Point S21.0486
Daily Pivot Point S31.0447
Daily Pivot Point R11.0567
Daily Pivot Point R21.0606
Daily Pivot Point R31.0627

Author

Anil Panchal

Anil Panchal

FXStreet

Anil Panchal has nearly 15 years of experience in tracking financial markets. With a keen interest in macroeconomics, Anil aptly tracks global news/updates and stays well-informed about the global financial moves and their implications.

More from Anil Panchal
Share:

Editor's Picks

EUR/USD holds above 1.1750 after mixed EU PMI data

EUR/USD manages to hold above 1.1750 but struggles to gather recovery momentum on Friday, following the mixed February PMI figures from Germany and the Eurozone. In the second half of the day, Q4 GDP, December inflation and February PMI data from the US will be watched closely by market participants.

GBP/USD recovers further toward 1.3500 after UK PMI data

GBP/USD is recovering ground further toward 1.3500 in European trading on Friday, helped by a modest uptick in the Pound Sterling after stronger-than-expected UK January Retail Sales and February PMI data. However, the pair's further upside could be limited amid persistent US Dollar strength as the focus turns to key US data. 

Gold sticks to positive bias above $5,000 ahead of US data

Gold gains some positive traction for the third consecutive day on Friday. holding above $5,000. Traders now look forward to the key US macro releases – the Advance Q4 GDP report and the Personal Consumption Expenditures (PCE) Price Index – for fresh trading impetus. 

US GDP growth expected to slow down significantly in Q4 after stellar Q3 

The United States Bureau of Economic Analysis will publish the first preliminary estimate of the fourth-quarter Gross Domestic Product at 13:30 GMT. Analysts forecast the US economy to have expanded at a 3% annualized rate, slowing down from the 4.4% growth posted in the previous quarter.

Iran tensions and AI fears at the forefront ahead of key US data

Thursday’s scorecard shows major US Stock benchmarks closed modestly in the red amid mounting US-Iran tensions and AI disruption worries. The S&P 500 shed 19 points (0.3%) to 6,861, the Nasdaq 100 lost 101 points (0.4%) to 24,797, and the Dow Jones Industrial Average dropped 267 points (0.5%) to 49,395.

Official Trump price approaches breakout with mixed signals from traders

Official Trump (TRUMP) is trading at $3.50 at the time of writing, approaching its upper consolidation range. A breakout from this range could open the door for an upside move. On-chain data shows market indecision, with balanced flows between bulls and bears, signaling a lack of clear directional bias.