|

EUR/USD Price Analysis: Pair struggles below 1.0750 to continue the winning streak

  • EUR/USD treads waters below the 1.0750 psychological level to extend gains.
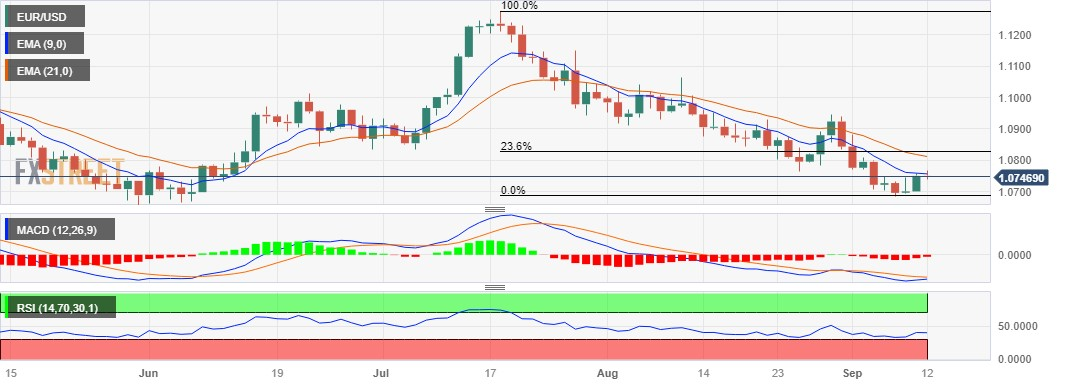
  • MACD suggests that recent momentum is tepid and favoring a sideways trend.
  • The 1.0700 psychological level appears to be initial support followed by the previous week’s low.
  • The key barrier level is represented by the nine-day EMA, following the 1.0800 psychological level.

EUR/USD struggles to continue the winning streak with a mild negative bias, trading around the 1.0740 aligned to the 1.0750 psychological level. The pair experienced upward support due to a pullback in the US Dollar (USD).

However, investors generally expect the ECB to adopt a dovish stance and keep interest rates unchanged at the policy meeting on Thursday. Nevertheless, it's important to note that any unexpected or surprising actions or statements from the ECB could still have the potential to unsettle the markets and introduce a level of uncertainty about the EUR/USD pair’s trajectory.

The Moving Average Convergence Divergence (MACD) line remains below the centerline but shows convergence below the signal line. This configuration indicates that the recent market momentum is relatively weak and moves sideways.

The pair may encounter initial support around the 1.0700 psychological level followed by the previous week’s low at 1.0685. A break below the level could push the EUR/USD traders to navigate the area around June’s low at 1.0661, followed by the 1.0650 psychological level.

On the upside, a significant resistance level for the EUR/USD pair is represented by the nine-day Exponential Moving Average (EMA) at 1.0756, following the 1.0800 psychological level.

If the pair manages to break convincingly above this level, it could potentially open the door for further upward movement to explore the region around 21-day EMA at 1.0811 aligned to 23.6% Fibonacci retracement at 1.0826 level.

In the short term, the EUR/USD pair is anticipated to sustain a bearish sentiment as long as the 14-day Relative Strength Index (RSI) remains below the 50 level. This implies that the pair is likely to continue experiencing downward momentum.

EUR/USD: Daily Chart

EUR/USD: additional important levels

Overview
Today last price1.0747
Today Daily Change-0.0003
Today Daily Change %-0.03
Today daily open1.075
 
Trends
Daily SMA201.0819
Daily SMA501.0946
Daily SMA1001.0908
Daily SMA2001.0825
 
Levels
Previous Daily High1.0759
Previous Daily Low1.0701
Previous Weekly High1.0809
Previous Weekly Low1.0686
Previous Monthly High1.1065
Previous Monthly Low1.0766
Daily Fibonacci 38.2%1.0737
Daily Fibonacci 61.8%1.0723
Daily Pivot Point S11.0714
Daily Pivot Point S21.0678
Daily Pivot Point S31.0656
Daily Pivot Point R11.0773
Daily Pivot Point R21.0795
Daily Pivot Point R31.0831

Author

Akhtar Faruqui

Akhtar Faruqui is a Forex Analyst based in New Delhi, India. With a keen eye for market trends and a passion for dissecting complex financial dynamics, he is dedicated to delivering accurate and insightful Forex news and analysis.

More from Akhtar Faruqui
Share:

Editor's Picks

GBP/USD back to 1.3250, down modestly for the day

GBP/USD now comes under fresh downside pressure and recedes toward the mid-1.3200s on Tuesday, partially reversing the optimism seen at the beginning of the week. Meanwhile, Cable’s bearish tone follows the resumption of the upside traction in the Greenback, always amid the sharp rally in USD/JPY.

EUR/USD looks inconclusive in the low 1.1400s

EUR/USD alternates gains with losses in the 1.1420 region in the latter part of the NA session on turnaround Tuesday. The pair’s vacillating price action comes amid the lack of clear direction in the US Dollar. Meanwhile, market participants are expected to gear up for the upcoming key releases on the US docket and developments from the ECB Forum in Sintra.

Gold seems vulnerable around $4,000 amid a bullish USD

Gold trades with a mild negative bias around $4,000 following the previous day's two-way price swings as the US Dollar stands firm amid safe-haven demand, bolstered by uncertainty surrounding US-Iran talks. Meanwhile, Tuesday's strong labor market data reaffirmed bets for a Fed rate hike in 2026 . This further underpins the buck and keeps the non-yielding bullion close to the YTD trough set the previous day.

Ethereum: Sharplink makes first treasury purchase in 2026 amid ETH's fall from grace

Ethereum treasury firm Sharplink resumed accumulation of the second-largest cryptocurrency by market capitalization last week after months on the sidelines. The Florida-based firm acquired 10,000 ETH last week at an average price of $1,611 per ETH, marking its first purchase since October. The move has pushed its holdings to 886,725 ETH worth roughly $1.4 billion at the time of writing.

Why a hawkish Bank of Japan could trigger the next Bitcoin sell-off

The Japanese Yen hits a 40-year low of 162.00 against the US Dollar, raising concerns about intervention or additional rate hikes by the Bank of Japan. BoJ may sell US Treasuries to buy back Yen, potentially pushing US bond yields higher and making Bitcoin less attractive to investors.

Kevin Warsh isn't expected to say much in Sintra: That's exactly why markets will listen

Financial markets could find an important catalyst in the enchanting, fairytale-like landscape of Sintra this week. The ECB Forum will, as it does every year, gather the crème de la crème of central banks. The new boss at the Fed, who has clearly said that the Fed should stop explaining everything, will need to talk – and traders should listen.