|

EUR/USD Price Analysis: Pair slides below 1.0300, indicators lose steam

  • EUR/USD declines by 0.48% on Wednesday, settling near 1.0295 after failing to break above the 20-day SMA.
  • RSI falls sharply to 39 in negative territory, revealing intensified selling pressure.
  • MACD histogram prints decreasing green bars, suggesting waning bullish momentum and a renewed downside tilt.

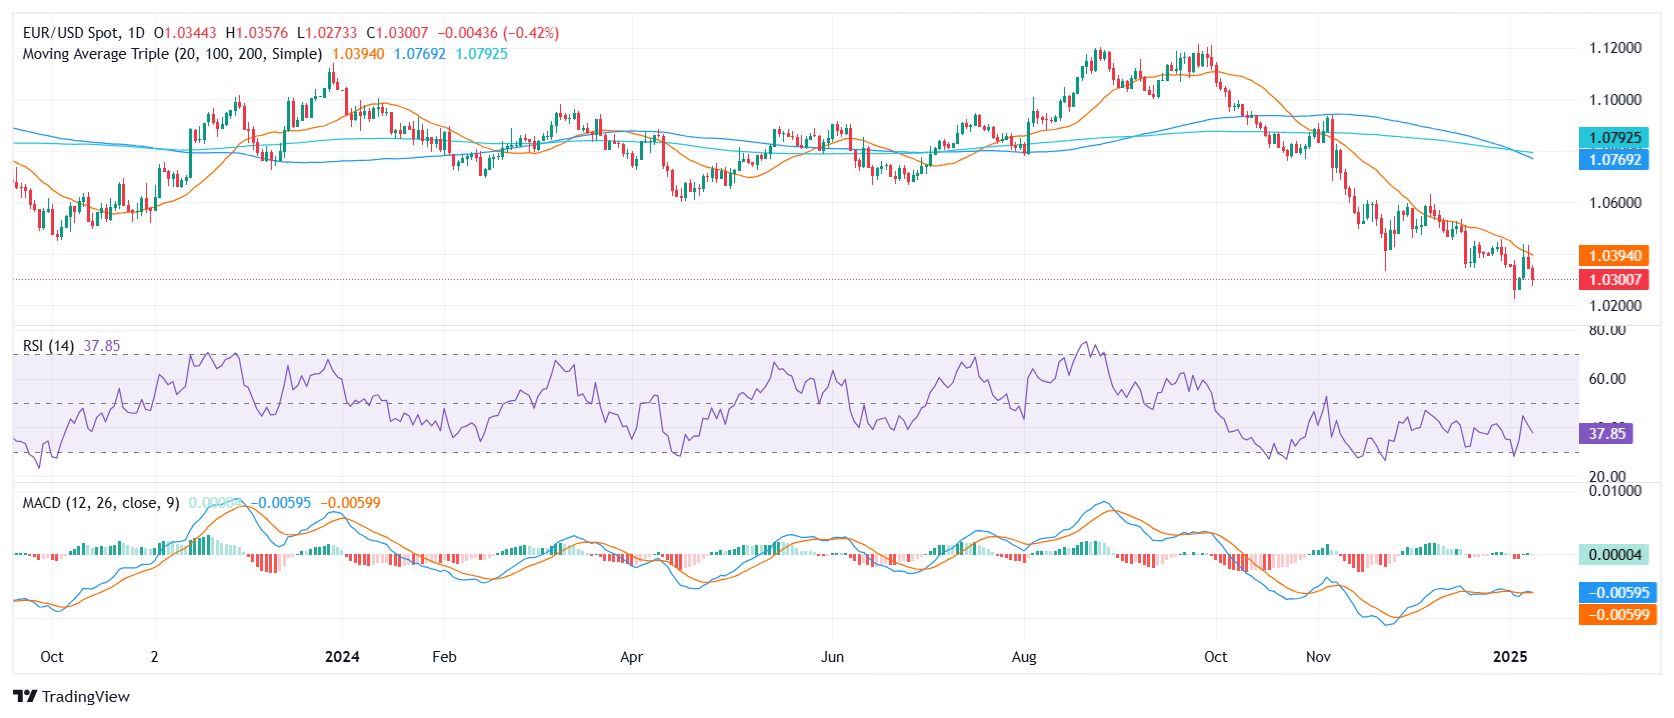
EUR/USD struggled on Wednesday, shedding 0.48% to trade around 1.0295. This latest drop underscores the pair’s inability to sustain any meaningful recovery, as multiple attempts to breach the 20-day Simple Moving Average (SMA) since early 2025 have been met with forceful selling. As a result, bullish momentum appears to be receding, leaving sellers firmly in control of the near-term price action.

Technical readings paint a downbeat picture. The Relative Strength Index (RSI) has dropped to 39, reinforcing the notion that downward pressure is picking up pace. Meanwhile, the Moving Average Convergence Divergence (MACD) histogram shows a decline in green bars, hinting that any previous efforts by buyers have begun to fade. Despite these setbacks, a definitive move above the 20-day SMA would still represent the clearest signal of a reversal, should buyers regroup and attempt another push higher.

Until that materializes, however, the path of least resistance remains tilted to the downside. Traders will keep a close watch on incoming macro catalysts and price action around the 20-day SMA for early signs of a possible turnaround.

EUR/USD daily chart

Author

Patricio Martín

Patricio is an economist from Argentina passionate about global finance and understanding the daily movements of the markets.

More from Patricio Martín
Share:

Markets move fast. We move first.

Orange Juice Newsletter brings you expert driven insights - not headlines. Every day on your inbox.

By subscribing you agree to our Terms and conditions.

Editor's Picks

EUR/USD bounces toward 1.1750 as US Dollar loses strength

EUR/USD returned to the 1.1750 price zone in the American session on Friday, despite falling Wall Street, which indicates risk aversion. Trading conditions remain thin following the New Year holiday and ahead of the weekend, with the focus shifting to US employment and European data scheduled for next week.

GBP/USD nears 1.3500, holds within familiar levels

After testing 1.3400 on the last day of 2025, GBP/USD managed to stage a rebound. Nevertheless, the pair finds it difficult to gather momentum and trades with modest intraday gains at around 1.3490 as market participants remain in holiday mood.

Gold trims intraday gains, approaches $4,300

Gold retreated sharply from the $4,400  area and trades flat for the day in the $4,320 price zone. Choppy trading conditions exacerbated the intraday decline, although XAU/USD bearish case is out of the picture, considering growing expectations for a dovish Fed and persistent geopolitical tensions.

Cardano gains early New Year momentum, bulls target falling wedge breakout

Cardano kicks off the New Year on a positive note and is extending gains, trading above $0.36 at the time of writing on Friday. Improving on-chain and derivatives data point to growing bullish interest, while the technical outlook keeps an upside breakout in focus.

Economic outlook 2026-2027 in advanced countries: Solidity test

After a year marked by global economic resilience and ending on a note of optimism, 2026 looks promising and could be a year of solid economic performance. In our baseline scenario, we expect most of the supportive factors at work in 2025 to continue to play a role in 2026.

Crypto market outlook for 2026

Year 2025 was volatile, as crypto often is.  Among positive catalysts were favourable regulatory changes in the U.S., rise of Digital Asset Treasuries (DAT), adoption of AI and tokenization of Real-World-Assets (RWA).