|

EUR/USD Price Analysis: Off yearly low inside nearby bearish channel, eyes to reclaim 1.1100

  • EUR/USD battles three-day-old resistance line inside short-term descending trend channel.
  • Nearly oversold RSI, a corrective pullback from weekly support line favor further recovery.
  • Bearish chart pattern, 50-SMA will challenge the bulls.

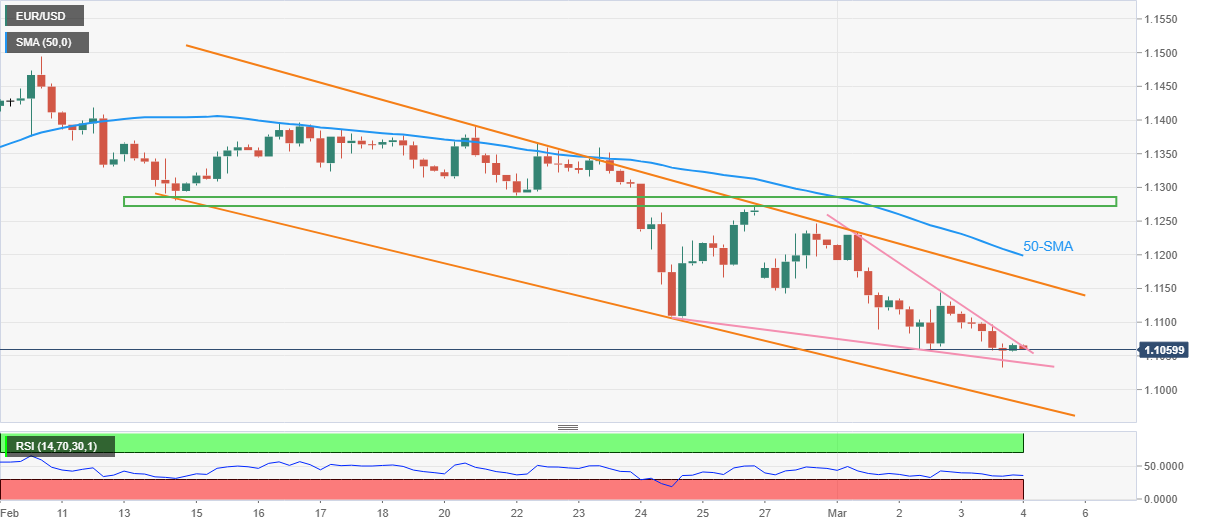
EUR/USD licks its wounds around the yearly bottom, bouncing off adjacent support to 1.1065 during Friday’s Asian session.

In doing so, the major currency pair pokes a nearby resistance line while staying inside a three-week-long falling channel.

Given the quote’s U-turn from a three-day-long support line amid almost oversold RSI, the EUR/USD prices may regain the 1.1100 mark on breaking the immediate hurdle surrounding 1.1070.

However, the stated channel’s upper line and the 50-SMA, respectively around 1.1165 and 1.1200, will challenge the quote’s further upside.

Even if the pair rises past 1.1200, a horizontal area from February 14, around 1.1270-85, will be crucial to watch for the bulls.

Alternatively, pullback moves may initially aim for the aforementioned nearby support line of 1.1040 ahead of the 1.1000 threshold.

The channel’s lower, though, will become a tough nut to crack for the pair sellers around 1.0980 afterward.

EUR/USD: Four-hour chart

Trend: Further downside expected

Additional important levels 

Overview
Today last price1.1066
Today Daily Change0.0003
Today Daily Change %0.03%
Today daily open1.1063
 
Trends
Daily SMA201.1309
Daily SMA501.1317
Daily SMA1001.1367
Daily SMA2001.1598
 
Levels
Previous Daily High1.1129
Previous Daily Low1.1034
Previous Weekly High1.1391
Previous Weekly Low1.1106
Previous Monthly High1.1495
Previous Monthly Low1.1106
Daily Fibonacci 38.2%1.107
Daily Fibonacci 61.8%1.1093
Daily Pivot Point S11.1021
Daily Pivot Point S21.098
Daily Pivot Point S31.0926
Daily Pivot Point R11.1117
Daily Pivot Point R21.1171
Daily Pivot Point R31.1213

Author

Anil Panchal

Anil Panchal

FXStreet

Anil Panchal has nearly 15 years of experience in tracking financial markets. With a keen interest in macroeconomics, Anil aptly tracks global news/updates and stays well-informed about the global financial moves and their implications.

More from Anil Panchal
Share:

Editor's Picks

AUD/USD eyes 0.7150 barrier nine-day EMA

AUD/USD inches higher after registering modest losses in the previous day, trading around 0.7130 during the Asian hours. The technical analysis of the daily chart indicates that the pair is moving sideways within the rectangle pattern, suggesting a consolidation as neither the bulls nor the bears have enough momentum to take control of the market.

USD/JPY trades below 160.00 intervention threshold; bullish bias intact

The USD/JPY pair attracts some sellers during the Asian session amid fears that authorities will step in again to prop up the Japanese Yen. Furthermore, the Israel-Lebanon truce prompts some profit-taking around the US Dollar and exerts downward pressure on the currency pair.

Gold extends rebound to $4,500 as US yields edge lower

Gold (XAU/USD) preserves its recovery momentum following Wednesday's slide and tests the $4,500 mark in the second half of the day on Thursday. While US-Iran uncertainty remains, easing tensions between Lebanon on Israel seems to be helping the market mood improve, causing the USD to lose strength alongside falling US T-bond yields and opening the door for a decisive rebound in XAU/USD.

Hyperliquid: ETF demand, capital rotation fuel HYPE rally as Bitcoin melts

Hyperliquid price sustains an upward trend near its all-time high of $75.76 on Thursday after posting 80% gains in May, while Bitcoin (BTC) retraces below $65,000, triggering a market-wide panic.

Nonfarm payrolls: Testing the limits of Fed policy patience

The upcoming nonfarm payrolls report for May will provide the final update on the US labor market before Kevin Warsh attends his first policy meeting as the new Fed Chair later this month.

Recession on paper: What really moves the Canadian Loonie now?

Statistics Canada handed the headline writers a gift and the analysts a headache. Real GDP shrank 0.1% on an annualized basis in the first quarter, and with the fourth quarter of 2025 revised down to a 1.0% contraction, that is two negative quarters in a row, the textbook definition of a technical recession and Canada's first since the pandemic.