|

EUR/USD Price Analysis: Moves above 1.0850; next barrier at previous week’s high

  • EUR/USD could retest the previous week’s high of 1.0876.
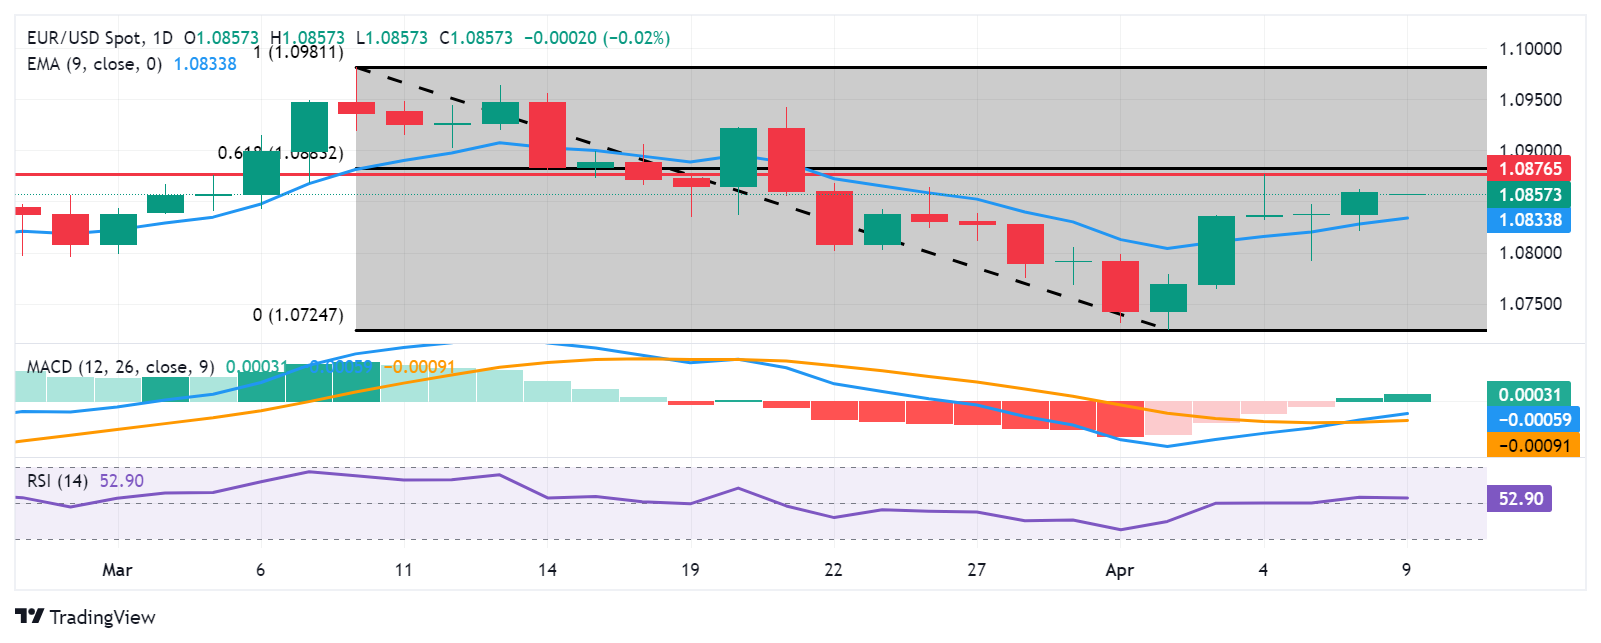
  • The resistance zone appears around the 61.8% Fibo level of 1.0883 and the psychological level of 1.0900.
  • The major level of 1.0850 could act as a key support, followed by the nine-day EMA at 1.0833.

EUR/USD put efforts to continue its winning streak for the sixth successive session on Tuesday. The pair hovers around 1.0860 during the Asian session. In the daily-frame chart, the pair shows that it is taking support on the nine-day Exponential Moving Average (EMA), which suggests that the pair could move upward to retest the strong resistance at the previous week’s high at 1.0876.

Furthermore, the EUR/USD pair could explore the 61.8% Fibonacci retracement level of 1.0883, followed by the psychological level of 1.0900.

Additionally, technical analysis suggests a bullish sentiment for the EUR/USD pair. The 14-day Relative Strength Index (RSI) is positioned above the 50 mark, indicating strength in buying momentum.

The lagging indicator, Moving Average Convergence Divergence (MACD), shows a divergence above the signal line, which indicates gaining strength for the pair. However, it is still positioned below the centreline. So, the traders are likely to await MACD to offer a clear trend direction.

On the downside, the EUR/USD pair could find immediate support at the major level of 1.0850, followed by the nine-day EMA at 1.0833. A break below this level could lead the pair to navigate the region around the psychological level of 1.0800 following the previous week’s low at 1.0724.

EUR/USD: Daily Chart

EUR/USD

Overview
Today last price1.0856
Today Daily Change-0.0003
Today Daily Change %-0.03
Today daily open1.0859
 
Trends
Daily SMA201.0847
Daily SMA501.083
Daily SMA1001.0874
Daily SMA2001.0833
 
Levels
Previous Daily High1.0862
Previous Daily Low1.0821
Previous Weekly High1.0876
Previous Weekly Low1.0725
Previous Monthly High1.0981
Previous Monthly Low1.0768
Daily Fibonacci 38.2%1.0846
Daily Fibonacci 61.8%1.0837
Daily Pivot Point S11.0833
Daily Pivot Point S21.0806
Daily Pivot Point S31.0791
Daily Pivot Point R11.0874
Daily Pivot Point R21.0889
Daily Pivot Point R31.0915

Author

Akhtar Faruqui

Akhtar Faruqui is a Forex Analyst based in New Delhi, India. With a keen eye for market trends and a passion for dissecting complex financial dynamics, he is dedicated to delivering accurate and insightful Forex news and analysis.

More from Akhtar Faruqui
Share:

Editor's Picks

AUD/USD stays bid above 0.7100 on Australian trade data, Mideast optimism

AUD/USD clings to minor recovery gains above 0.7100 in the Asian session on Thursday as a new Israel-Lebanon ceasefire keeps a lid on the safe-haven US Dollar. Meanwhile, strong AustralianTrade Balane data also help the Aussie pair sustain the bounce from weekly lows.

USD/JPY hovers near the 160.00 intervention threshold on Mideast tensions

USD/JPY struggles to find acceptance above 160.00 and retreats from a one-month high in the Asian session on Thursday amid fears that authorities will step in again to prop up the Japanese Yen. Furthermore, a new Israel-Lebanon ceasefire caps the US Dollar and supports the currency pair. However, renewed US-Iran tensions keep the downside limited in the Greenback and the pair.

Gold rebounds from one-week low as Israel-Lebanon truce pressures safe-haven USD

Gold gains some positive traction on Thursday and climbs to the $4,475 area during the Asian session, reversing a major part of the previous day's slide to a one-week low. The Israel-Lebanon truce prompts some profit-taking around the US Dollar and supports the commodity. 


Hyperliquid: ETF demand, capital rotation fuel HYPE rally as Bitcoin melts

Hyperliquid price sustains an upward trend near its all-time high of $75.76 on Thursday after posting 80% gains in May, while Bitcoin (BTC) retraces below $65,000, triggering a market-wide panic.

Kevin Warsh takes the Fed helm: What it means for the US Dollar
The Federal Reserve moves away from the highly predictable "forward guidance" model of the Jerome Powell era to a new “Kevin Warsh environment”, characterized by less communication, more policy surprises, and an increased focus on the Fed's complex balance sheet.
Recession on paper: What really moves the Canadian Loonie now?

Statistics Canada handed the headline writers a gift and the analysts a headache. Real GDP shrank 0.1% on an annualized basis in the first quarter, and with the fourth quarter of 2025 revised down to a 1.0% contraction, that is two negative quarters in a row, the textbook definition of a technical recession and Canada's first since the pandemic.