|

EUR/USD Price Analysis: Licks its wounds below 1.0820 key hurdle

  • EUR/USD remains sidelined after breaking short-term important support.
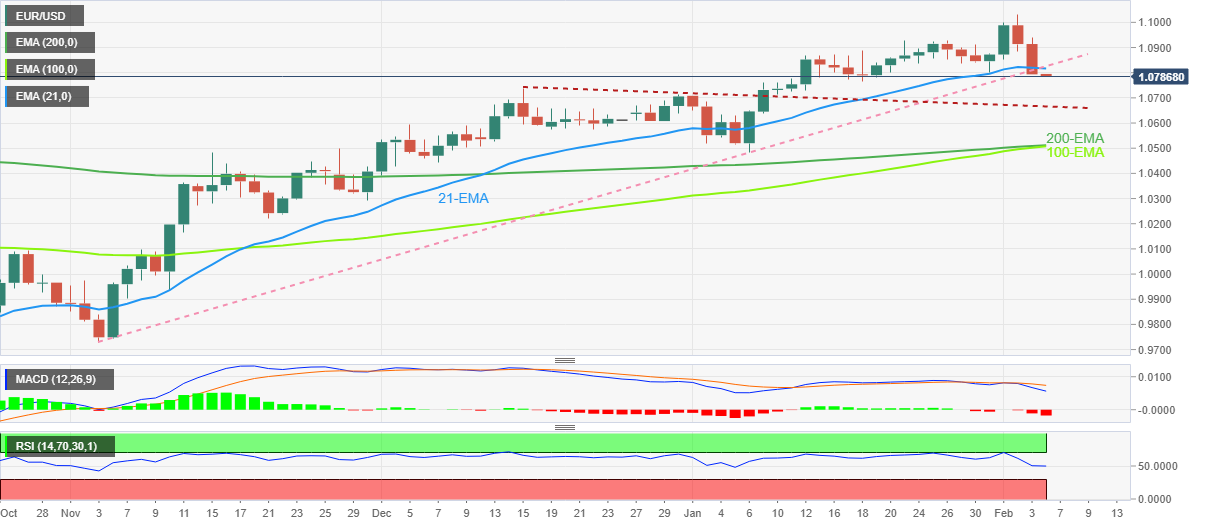
  • Bearish MACD signals, steady RSI favor sellers targeting previous resistance line.
  • Convergence of 100-EMA, 200-EMA appears a tough nut to crack for EUR/USD bears.

EUR/USD licks its wounds around 1.0790 after a two-day pullback from the highest levels since April 2022. Even so, the major currency pair defends the previous day’s break of the 21-day Exponential Moving Average (EMA) and an upward-sloping support line from early November 2022.

Not only the sustained downside break of the previous key support confluence but the bearish MACD signals and steady RSI (14) also keeps the EUR/USD sellers hopeful.

That said, a seven-week-old resistance-turned-support line near 1.0660 appears the immediate target for the EUR/USD bears to watch before aiming for the 1.0500 support confluence including the 100-EMA and 200-EMA.

It’s worth noting that the previous monthly low near 1.0480 acts as an extra filter towards the south before welcoming the EUR/USD bears.

On the flip side, the 21-day EMA and the three-month-old previous support line challenge the EUR/USD bulls near 1.0820.

Following that, multiple levels near 1.0900 and 1.0920 could test the pair’s further upside before highlighting the latest peak surrounding 1.1035.

In a case where EUR/USD remains firmer past 1.1035, the odds of witnessing a rally toward the March 2022 high near 1.1185 can’t be ruled out.

Overall, EUR/USD remains on the bear’s radar despite the latest inaction.

EUR/USD: Daily chart

Trend: Further downside expected

Additional important levels

Overview
Today last price1.0787
Today Daily Change-0.0006
Today Daily Change %-0.06%
Today daily open1.0793
 
Trends
Daily SMA201.0842
Daily SMA501.0677
Daily SMA1001.032
Daily SMA2001.0319
 
Levels
Previous Daily High1.094
Previous Daily Low1.0793
Previous Weekly High1.1033
Previous Weekly Low1.0793
Previous Monthly High1.093
Previous Monthly Low1.0483
Daily Fibonacci 38.2%1.0849
Daily Fibonacci 61.8%1.0884
Daily Pivot Point S11.0744
Daily Pivot Point S21.0695
Daily Pivot Point S31.0597
Daily Pivot Point R11.0891
Daily Pivot Point R21.0989
Daily Pivot Point R31.1038

Author

Anil Panchal

Anil Panchal

FXStreet

Anil Panchal has nearly 15 years of experience in tracking financial markets. With a keen interest in macroeconomics, Anil aptly tracks global news/updates and stays well-informed about the global financial moves and their implications.

More from Anil Panchal
Share:

Editor's Picks

AUD/USD eyes 0.7150 barrier nine-day EMA

AUD/USD inches higher after registering modest losses in the previous day, trading around 0.7130 during the Asian hours. The technical analysis of the daily chart indicates that the pair is moving sideways within the rectangle pattern, suggesting a consolidation as neither the bulls nor the bears have enough momentum to take control of the market.

USD/JPY trades below 160.00 intervention threshold; bullish bias intact

The USD/JPY pair attracts some sellers during the Asian session amid fears that authorities will step in again to prop up the Japanese Yen. Furthermore, the Israel-Lebanon truce prompts some profit-taking around the US Dollar and exerts downward pressure on the currency pair.

Gold rebounds from one-week low as Israel-Lebanon truce pressures safe-haven USD

Gold gains some positive traction on Thursday and climbs to the $4,475 area during the Asian session, reversing a major part of the previous day's slide to a one-week low. The Israel-Lebanon truce prompts some profit-taking around the US Dollar and supports the commodity. 


Hyperliquid: ETF demand, capital rotation fuel HYPE rally as Bitcoin melts

Hyperliquid price sustains an upward trend near its all-time high of $75.76 on Thursday after posting 80% gains in May, while Bitcoin (BTC) retraces below $65,000, triggering a market-wide panic.

Kevin Warsh takes the Fed helm: What it means for the US Dollar
The Federal Reserve moves away from the highly predictable "forward guidance" model of the Jerome Powell era to a new “Kevin Warsh environment”, characterized by less communication, more policy surprises, and an increased focus on the Fed's complex balance sheet.
Recession on paper: What really moves the Canadian Loonie now?

Statistics Canada handed the headline writers a gift and the analysts a headache. Real GDP shrank 0.1% on an annualized basis in the first quarter, and with the fourth quarter of 2025 revised down to a 1.0% contraction, that is two negative quarters in a row, the textbook definition of a technical recession and Canada's first since the pandemic.