|

EUR/USD Price Analysis: Flips 200-hour MA resistance and rises above 1.09

  • EUR/USD has crossed the 200-hour average hurdle at 1.0888. 
  • Technical studies indicate a strengthening of the upward momentum. 
  • Support at 1.0888 is the level to beat for the sellers. 

EUR/USD is gaining altitude in Asia. The currency pair toppled the 200-hour moving average hurdle a few minutes before press time and is currently trading at session highs near 1.0920. 

The single currency is drawing bids despite the US Senate struggling to approve the coronavirus fiscal stimulus bill. As per the latest reports, the bill will be put to vote in the Senate in an hour from now. 

If the bill is passed, the risky assets could rally, weakening the haven demand for the dollar and powering further gains in EUR/USD.

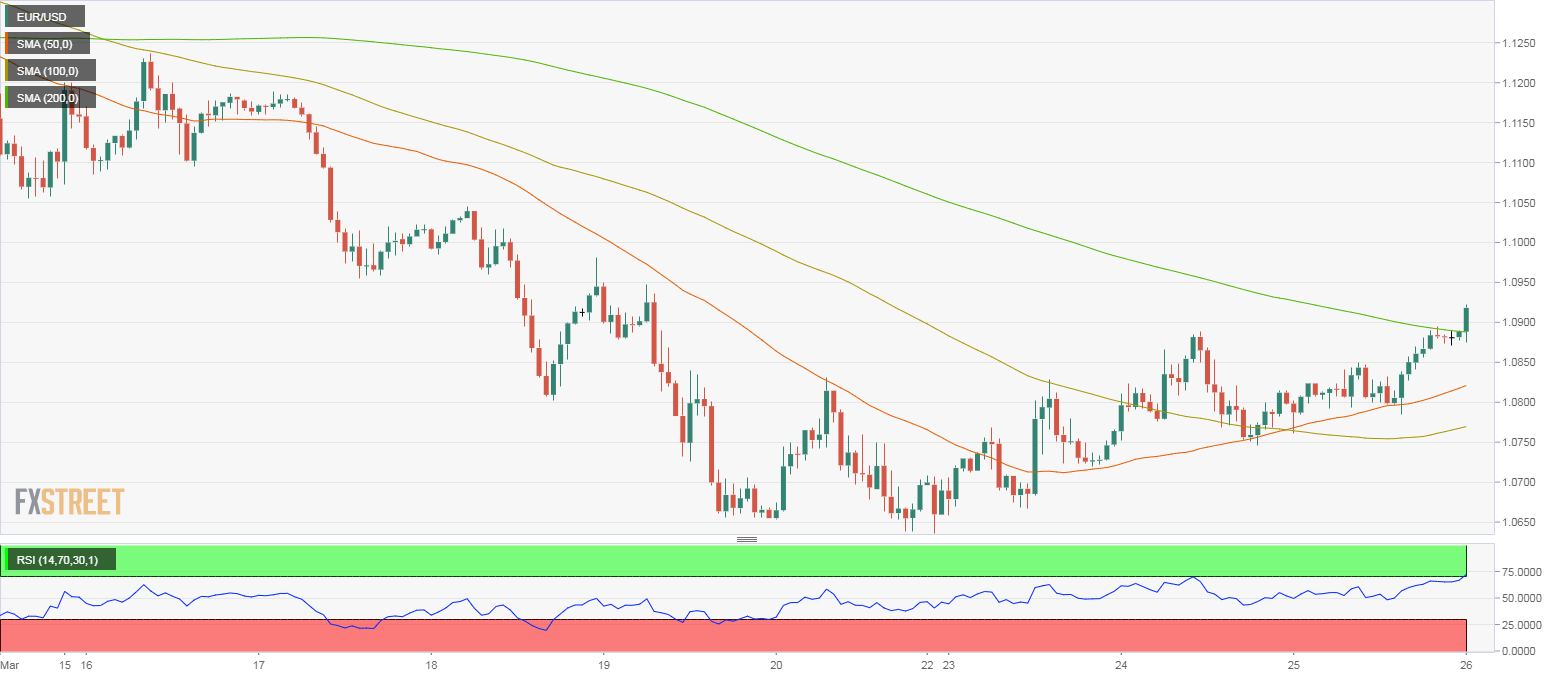
Froma technical perspective, the upward momentum looks strong with the 50- and 100-hour averages trending north. The averages produced a bullish crossover earlier this week. The hourly chart RSI is looking north and reporting the strongest bullish bias since March 3. 

The immediate bullish case would further strengthen if the current hourly candle closes well above 1.0888. That would establish a higher high and open the doors to 1.0982 (March 18 high on the hourly chart). 

The bias as per the hourly chart would turn bearish if the spot drops below 1.0785, invalidating the higher lows setup. 

Hourly chart

Trend: Bullish

Technical levels

EUR/USD

Overview
Today last price1.0917
Today Daily Change0.0031
Today Daily Change %0.28
Today daily open1.0882
 
Trends
Daily SMA201.1059
Daily SMA501.1001
Daily SMA1001.1048
Daily SMA2001.1085
 
Levels
Previous Daily High1.0894
Previous Daily Low1.0761
Previous Weekly High1.1237
Previous Weekly Low1.0638
Previous Monthly High1.1089
Previous Monthly Low1.0778
Daily Fibonacci 38.2%1.0843
Daily Fibonacci 61.8%1.0812
Daily Pivot Point S11.0797
Daily Pivot Point S21.0712
Daily Pivot Point S31.0664
Daily Pivot Point R11.0931
Daily Pivot Point R21.0979
Daily Pivot Point R31.1064

Author

Omkar Godbole

Omkar Godbole

FXStreet Contributor

Omkar Godbole, editor and analyst, joined FXStreet after four years as a research analyst at several Indian brokerage companies.

More from Omkar Godbole
Share:

Editor's Picks

EUR/USD looks apathetic around 1.1770

EUR/USD comes under renewed pressure on Tuesday, deflating below the 1.1800 support and reversing two consecutive days of gains. The pair’s decline follows the persistent move higher in the US Dollar, as trade uncertainty dominates the sentiment ahead of President Trump’s SOTU speech.

GBP/USD regains 1.3500 and above

GBP/USD extends its advance for the third day in a row on Tuesday, this time retesting the area beyond the 1.3500 hurdle. Cable’s uptick comes despite decent gains in the Greenback and the dovish message from the BoE’s Bailey at the UK Parliament.

Gold appears offered around $5,150

Gold is giving back a good portion of the recent multi-day rally, receding to the $5,150 zone per troy ounce amid the decent bounce in the US Dollar and mixed US Treasuty yields. In the meantime, markets’ attention remain on upcoming comments from Fed speakers.

Ripple’s DeFi shift in focus: Navigating XRPL EVM sidechain growth, XRPFi migration and liquidity

Ripple (XRP) has continued to trade under pressure, extending its decline by approximately 63% from the record high of $3.66 in July. The remittance token is trading above support at $1.35, while its upside appears limited by key supply zones, starting with $1.40, at the time of writing on Tuesday.

The Citrini report: How a debatable AI narrative can shake Wall Street

That AI-related headline alone was enough to rattle investors.US stocks slid sharply on Monday after a widely circulated Citrini Research memo outlined a hypothetical “2028 Global Intelligence Crisis”, warning that rapid AI adoption could push US unemployment into double digits as early as by mid-2028.

XRP pressured by weak ETF flows and declining retail interest

Ripple (XRP) is edging lower, trading above its intraday low of $1.32 at the time of writing on Tuesday. The decline from its weekly opening of $1.39 reflects heightened volatility in the broader cryptocurrency market, accentuated by tariff-triggered uncertainty.