EUR/USD Price Analysis: Extra gains could be selling opportunities


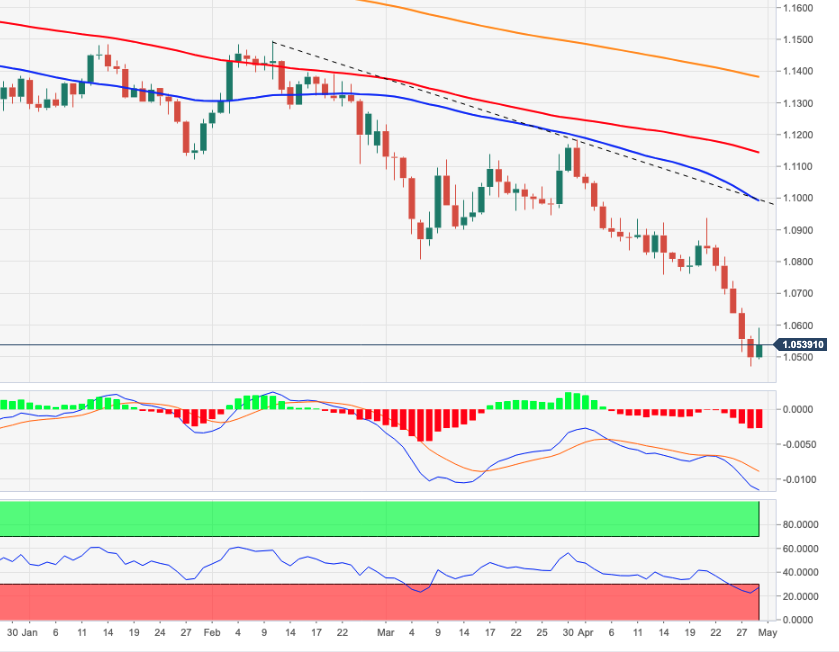
  • EUR/USD rebounds to the proximity of 1.0600 on Friday.
  • Another visit to the YTD low at 1.0470 stays on the cards.

EUR/USD attempts a technical bounce following oversold levels, although the move ran out of steam near 1.0600 at the end of the week.

The offered stance in the pair remains well and sound despite Friday’s bounce and the door stays open to another probable visit to the YTD low around 1.0470 (April 28).

While below the 2-month line around 1.0990, extra losses in the pair are likely.

EUR/USD daily chart

EUR/USD

Overview
Today last price 1.0536
Today Daily Change 102
Today Daily Change % 0.35
Today daily open 1.0499
 
Trends
Daily SMA20 1.0813
Daily SMA50 1.0972
Daily SMA100 1.1151
Daily SMA200 1.1388
 
Levels
Previous Daily High 1.0566
Previous Daily Low 1.0471
Previous Weekly High 1.0936
Previous Weekly Low 1.0761
Previous Monthly High 1.1233
Previous Monthly Low 1.0806
Daily Fibonacci 38.2% 1.0507
Daily Fibonacci 61.8% 1.053
Daily Pivot Point S1 1.0458
Daily Pivot Point S2 1.0418
Daily Pivot Point S3 1.0364
Daily Pivot Point R1 1.0552
Daily Pivot Point R2 1.0606
Daily Pivot Point R3 1.0647


Share: Feed news

Information on these pages contains forward-looking statements that involve risks and uncertainties. Markets and instruments profiled on this page are for informational purposes only and should not in any way come across as a recommendation to buy or sell in these assets. You should do your own thorough research before making any investment decisions. FXStreet does not in any way guarantee that this information is free from mistakes, errors, or material misstatements. It also does not guarantee that this information is of a timely nature. Investing in Open Markets involves a great deal of risk, including the loss of all or a portion of your investment, as well as emotional distress. All risks, losses and costs associated with investing, including total loss of principal, are your responsibility. The views and opinions expressed in this article are those of the authors and do not necessarily reflect the official policy or position of FXStreet nor its advertisers. The author will not be held responsible for information that is found at the end of links posted on this page.

If not otherwise explicitly mentioned in the body of the article, at the time of writing, the author has no position in any stock mentioned in this article and no business relationship with any company mentioned. The author has not received compensation for writing this article, other than from FXStreet.

FXStreet and the author do not provide personalized recommendations. The author makes no representations as to the accuracy, completeness, or suitability of this information. FXStreet and the author will not be liable for any errors, omissions or any losses, injuries or damages arising from this information and its display or use. Errors and omissions excepted.

The author and FXStreet are not registered investment advisors and nothing in this article is intended to be investment advice.

Recommended content


Recommended content

Editors’ Picks

EUR/USD turns positive above 1.1500, Dollar retreats

EUR/USD turns positive above 1.1500, Dollar retreats

EUR/USD now makes a reversal, up modestly for the day after surpassing the 1.1500 barrier. The pair’s rebound came on the back of increasing and renewed selling pressure around the Greenback, particularly after FOMC Governor M. Bowman opened the door to a July rate cut. Meanwhile, investors remain watchful of the geopolitical landscape ahead of a potential move by Iran in response to the recent US attacks.

Could Iran block the Strait of Hormuz? Why Oil is on edge after US strikes

Could Iran block the Strait of Hormuz? Why Oil is on edge after US strikes

As the Israel-Iran conflict reaches new heights, an old threat is coming back to haunt the markets: that of the closure of the Strait of Hormuz. This narrow arm of the sea in the Persian Gulf, wedged between Iran to the north and the United Arab Emirates and Oman to the south, is much more than a simple sea passage.

Gold treads water below $3,400 on stronger USD

Gold treads water below $3,400 on stronger USD

Gold begins the week on a downward trend, trading below the key $3,400 mark per troy ounce. In the meantime, the precious metal has managed to limit its losses amid the stronger US Dollar (USD) and rising geopolitical tensions in the Middle East.

AI Tokens Price Prediction: Story, Virtuals Protocol rebound following sell-off after US strikes on Iran

AI Tokens Price Prediction: Story, Virtuals Protocol rebound following sell-off after US strikes on Iran

Geopolitical tensions in the Middle East caused a liquidation havoc of over $1 billion in the cryptocurrency market over the weekend, following US President Donald Trump’s direct involvement in the conflict between Israel and Iran.

GBP/USD climbs to daily highs around 1.3480

GBP/USD climbs to daily highs around 1.3480

After bottoming out in multi-week lows near 1.3370, GBP/USD now picks up pace and gains around a cent to hit new daily peaks around 1.3480 in response to fresh selling pressure hitting the Greenback. The knee-jerk in the US Dollar comes despite steady fears on the Iran-Israel-US front and firm results from preliminary US PMIs for the month of June. On the UK docket, all the attention remains on upcoming flash Manufacturing and Services PMIs.

The Best brokers to trade EUR/USD

The Best brokers to trade EUR/USD

SPONSORED Discover the top brokers for trading EUR/USD in 2025. Our list features brokers with competitive spreads, fast execution, and powerful platforms. Whether you're a beginner or an expert, find the right partner to navigate the dynamic Forex market.

Forex MAJORS

Cryptocurrencies

Signatures

Best Brokers of 2025