|

EUR/USD Price Analysis: Euro grinds up in mid-1.0900s on Good Friday

  • EUR/USD is moving up slowly on Good Friday’s low volatility. 
  • Resistance is seen in the 1.0978/1.1000 price zone.   
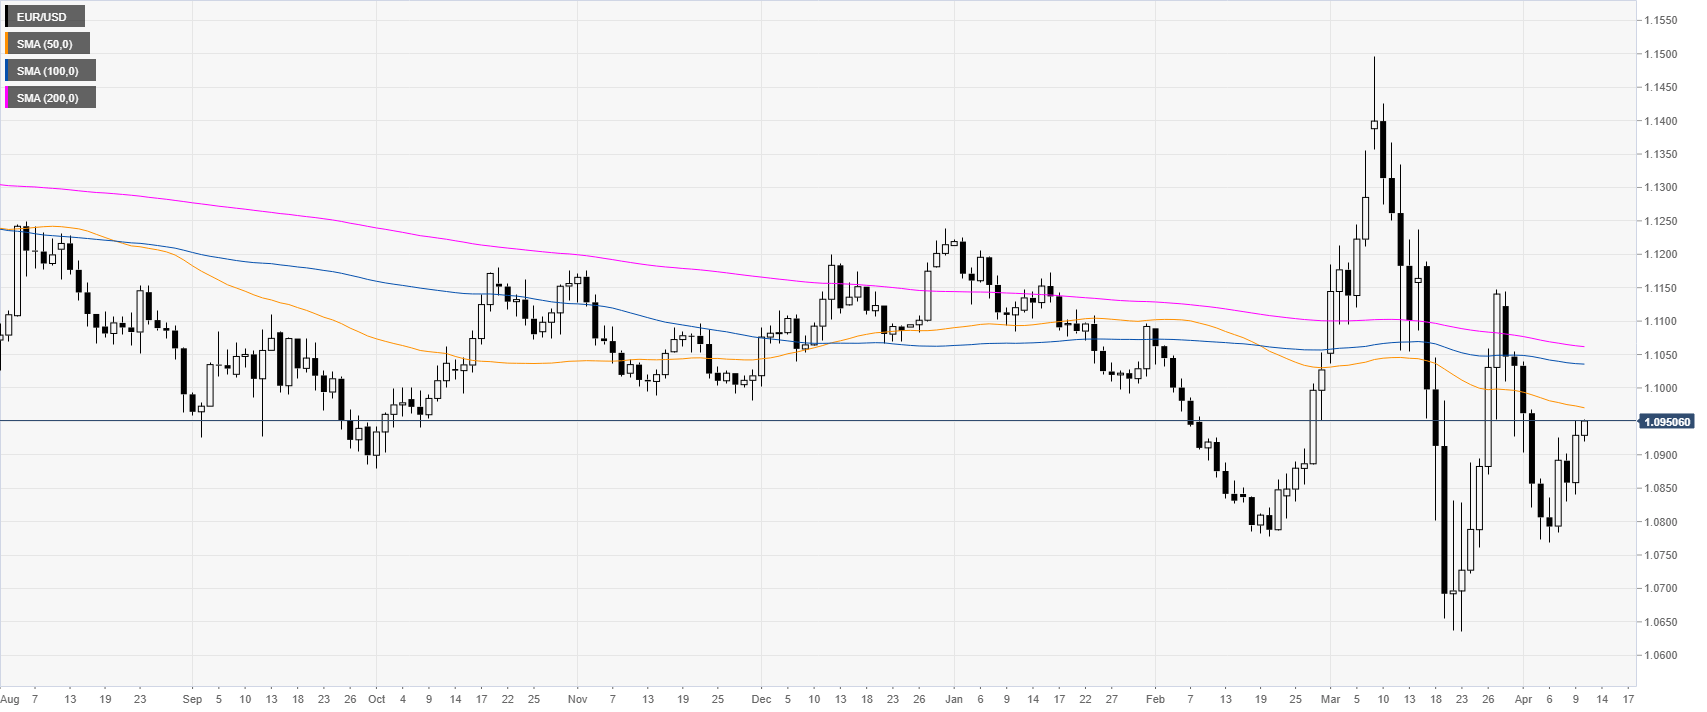
 

EUR/USD daily chart 

 
EUR/USD is rebounding from the 1.0800 figure while trading below its main SMA (simple moving average) on the daily chart. This week, the Fed announced the injection of $2.3 trillion in additional loans while US jobless claims soared above 6.6 million.
 

EUR/USD four-hour chart

 
EUR/USD is consolidating below the 200 SMA suggesting a bearish bias in the medium term. However, the spot is grinding up while nearing the 1.0978/1.1000 resistance zone. Further up lie the 1.1050 resistance. Sellers, on the other hand, would need a daily close below the 1.0910 support level to gather traction towards the 1.0890 and 1.0842 price levels, according to the Technical Confluences Indicator.  
 
 
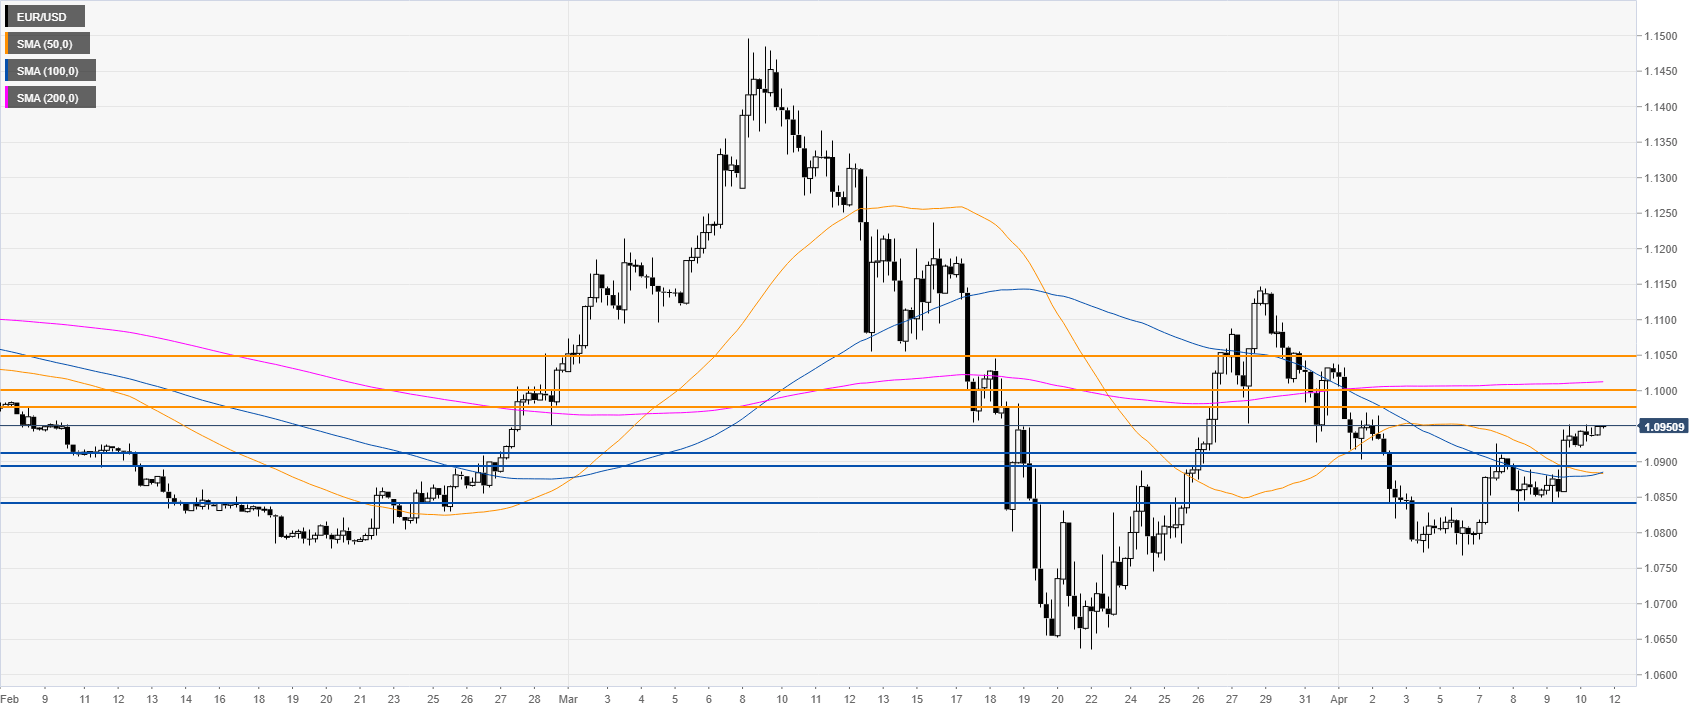
Resistance: 1.0978, 1.1000, 1.1050
Support: 1.0910, 1.0890, 1.0842 


Additional key levels

EUR/USD

Overview
Today last price1.095
Today Daily Change0.0021
Today Daily Change %0.19
Today daily open1.0929
 
Trends
Daily SMA201.0916
Daily SMA501.0975
Daily SMA1001.1037
Daily SMA2001.1063
 
Levels
Previous Daily High1.0952
Previous Daily Low1.0841
Previous Weekly High1.1144
Previous Weekly Low1.0773
Previous Monthly High1.1497
Previous Monthly Low1.0636
Daily Fibonacci 38.2%1.0909
Daily Fibonacci 61.8%1.0883
Daily Pivot Point S11.0863
Daily Pivot Point S21.0796
Daily Pivot Point S31.0752
Daily Pivot Point R11.0974
Daily Pivot Point R21.1018
Daily Pivot Point R31.1084

Author

Flavio Tosti

Flavio Tosti

Independent Analyst


More from Flavio Tosti
Share:

Editor's Picks

EUR/USD recovers some early losses driven by rising energy prices amid US-Iran war

The EUR/USD pair claws back some of its early losses during the late Asian trading session on Monday, but is still 0.25% down to near 1.1780. Earlier in the day, the Euro declined sharply against the US Dollar as investors shifted to the safe-haven fleet amid the brutal war between Iran, Israel, and the United States, which broke out over the weekend.

GBP/USD targets 1.3500 barrier near moving averages

GBP/USD rebounds from the daily losses, trading around 1.3450 during the Asian hours on Monday. The technical analysis of the daily chart indicates an ongoing bearish bias, as the pair trades within a descending channel pattern.

Gold looks further north as Iran war boosts haven demand

Gold is taking a breather after the initial run to over one-month highs near $5,400, kicking off the new week with a bang. A global flight to safety theme, following the US-Israel joint attacks on Iran over the weekend, bolstered the demand for the traditional store of value, Gold.

Bitcoin, Ethereum and Ripple under pressure as key supports face breakdown risk

Bitcoin, Ethereum, and Ripple prices trade on the back foot at the start of this week on Monday, after extending losses in the previous week. BTC is on the brink of a breakdown, ETH is capped below key resistance, and XRP risks a crack of the trendline.

The market is paying for insurance, not apocalypse

As expected, this morning felt less like a Monday market open and more like a fire drill. Futures screens flickered red. S&P contracts down almost 1%. Nasdaq off 1.2%. Brent leaped 13% through $80. Gold rose 1.6% toward $5350 before paring some gains. The dollar is strutting mildly. The Swiss franc is quietly doing what it always does in a storm, catching some safe-haven flows.

Starknet unveils strkBTC, shielded Bitcoin transactions on Ethereum Layer 2

Starknet, the Ethereum Layer 2 network developed by StarkWare, today announced strkBTC, a wrapped Bitcoin asset that introduces optional shielding while preserving full DeFi composability.