|

EUR/USD Price Analysis: Daily correction before further upside, 1.0950s eyed

  • EUR/USD bulls taking on the bears with eyes to 1.0950.
  • The daily candle or this week's candle needs to close in the green.

As per the prior analysis, EUR/USD Price Analysis: Weekly bullish M-formation is starting to play out, the bulls have eyed the M-formation on the weekly chart. Following the prior session's sharp rally, there has been a correction on Thursday to mitigate the imbalance of price. In due course, an onwards continuation could be on the cards. 

EUR/USD weekly chart

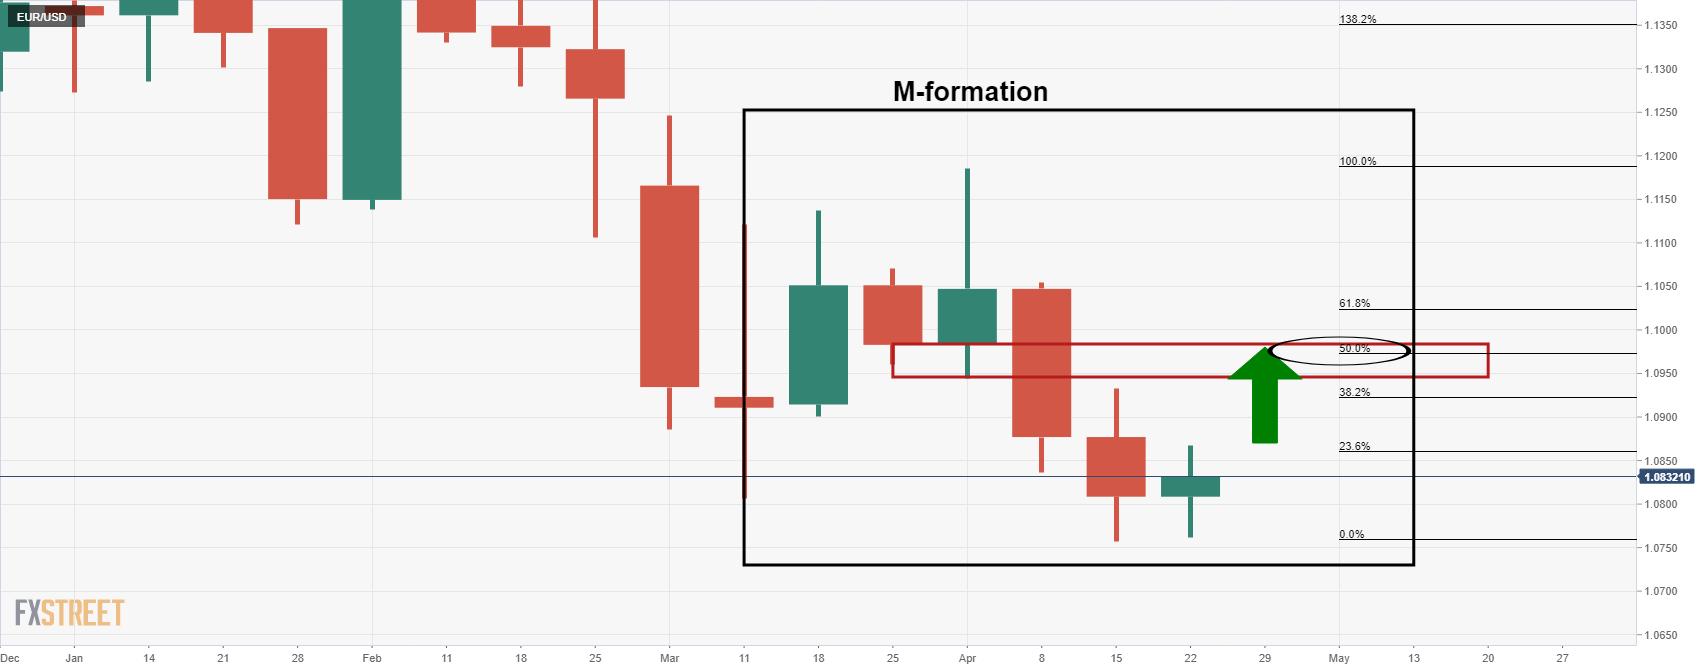
The M-formation is a reversion pattern, and the bulls will be eyeing the neckline in order to mitigate the imbalance of the price. The area can be targeted from a lower time frame perspective. The daily chart is the first place to start such analysis in order to determine the progress of the formation of a bullish structure. 

EUR/USD daily chart

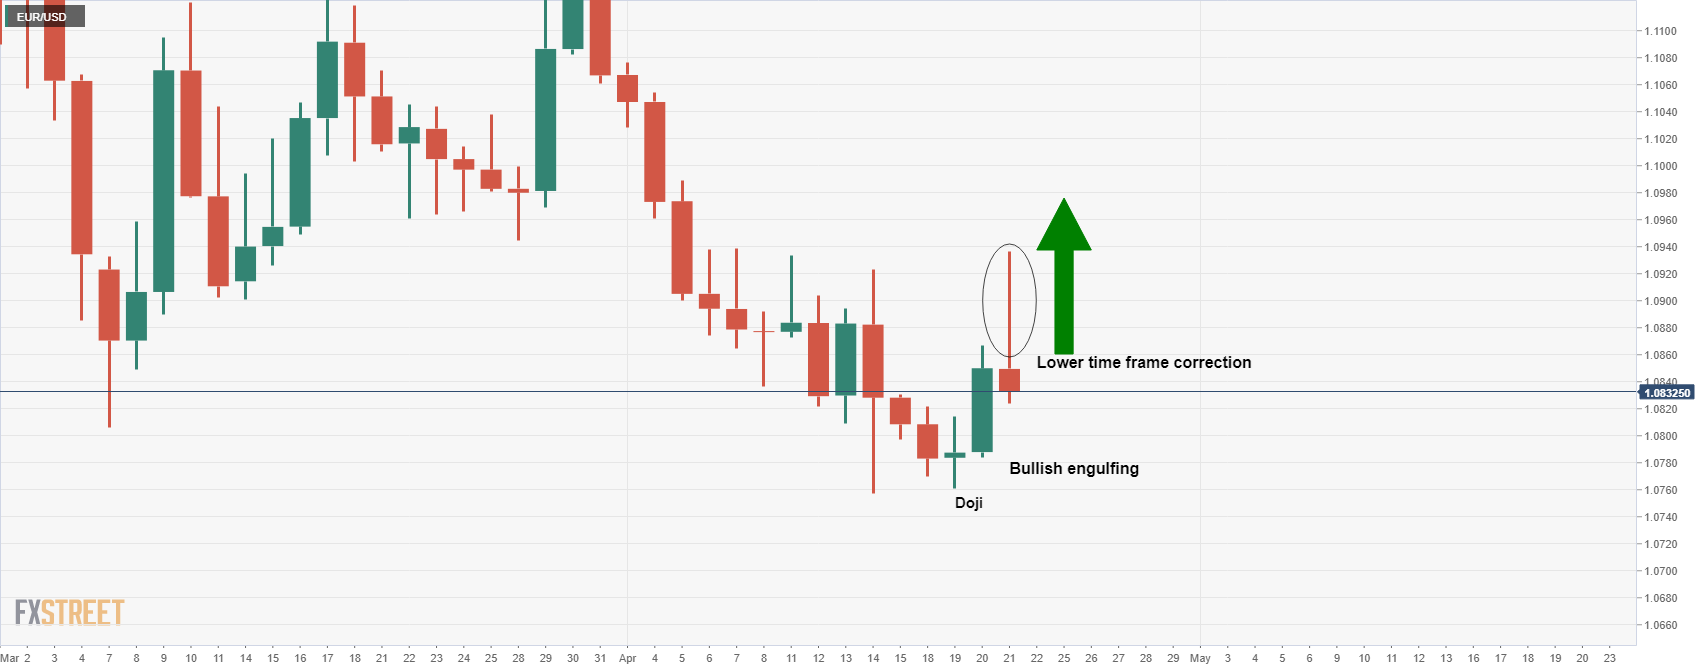
The price has subsequently rallied towards the neckline of the M-formation following the bullish candlestick pattern with the doji followed by the bullish engulfing candle. However, there has been a strong rejection, and the bulls will want to see the daily candle close higher than the prior days in order to add conviction to the upside thesis. That being said, so long as the week closes in the green, there will be prospects of a bullish continuation for next week. 

Author

Ross J Burland

Ross J Burland, born in England, UK, is a sportsman at heart. He played Rugby and Judo for his county, Kent and the South East of England Rugby team.

More from Ross J Burland
Share:

Editor's Picks

EUR/USD eyes nine-day EMA barrier after rebounding from 1.1600

EUR/USD gains ground after registering modest losses in the previous session, trading around 1.1620 during the Asian hours on Friday. The technical analysis of the daily chart suggests an ongoing bearish bias as the pair remains within the descending channel pattern.

GBP/USD: Pound Sterling ticks up against US Dollar in countdown to US NFP

The Pound Sterling trades marginally higher to near 1.3365 against the US Dollar during the Asian trading session on Friday. The GBP/USD pair edges up as the US Dollar ticks down ahead of the United States Nonfarm Payrolls data for February, which will be published at 13:30 GMT.

Gold advances on increased safe-haven demand

Gold price recovers its recent losses from the previous session. The yellow metal advances as the broader precious metals market rebounds on safe-haven demand. However, the yellow metal is on track for its first weekly decline in five weeks as escalating Middle East tensions push oil prices higher, fueling inflation concerns and reducing bets on Federal Reserve rate cuts.

Bitcoin, Ethereum and Ripple at risk as US-Iran war extends

Bitcoin, Ethereum, and Ripple trade cautiously at press time on Friday, close to key support levels after a roughly 2% pullback the previous day. Bitcoin holds above $71,000, Ethereum at $2,000, and XRP continues to consolidate in a sideways range.

The market compass is pointing at a barrel of Oil

The Asian open is arriving with equities leaning the wrong way, and the reason is not complicated. The market’s compass needle has snapped firmly toward crude. In this tape, oil is not just another input price; it is the gravitational center around which every asset class is orbiting.

Top 3 Price Prediction: Bitcoin, Ethereum, Ripple at risk as US-Iran war extends

Bitcoin, Ethereum, and Ripple trade cautiously at press time on Friday, close to key support levels after a roughly 2% pullback the previous day. Bitcoin holds above $71,000, Ethereum at $2,000, and XRP continues to consolidate in a sideways range.