|

EUR/USD Price Analysis: Bulls regain control, breaking key resistance levels

  • EUR/USD surged at the start of the week, posting strong gains and reclaiming higher ground.
  • The pair soared past the convergence of the 20-day and 100-day SMA, signaling renewed bullish momentum.
  • Resistance is now seen at 1.0520, while support lies at 1.0450, with indicators suggesting further upside potential.

EUR/USD kicked off the week with a solid rally rising past 1.0450, climbing above key technical levels and suggesting that buyers are regaining momentum. The pair decisively broke through the confluence of the 20-day and 100-day Simple Moving Averages (SMA), reinforcing a shift in sentiment. This move comes after last week's struggle around these levels, where sellers had temporarily kept the pair in check.

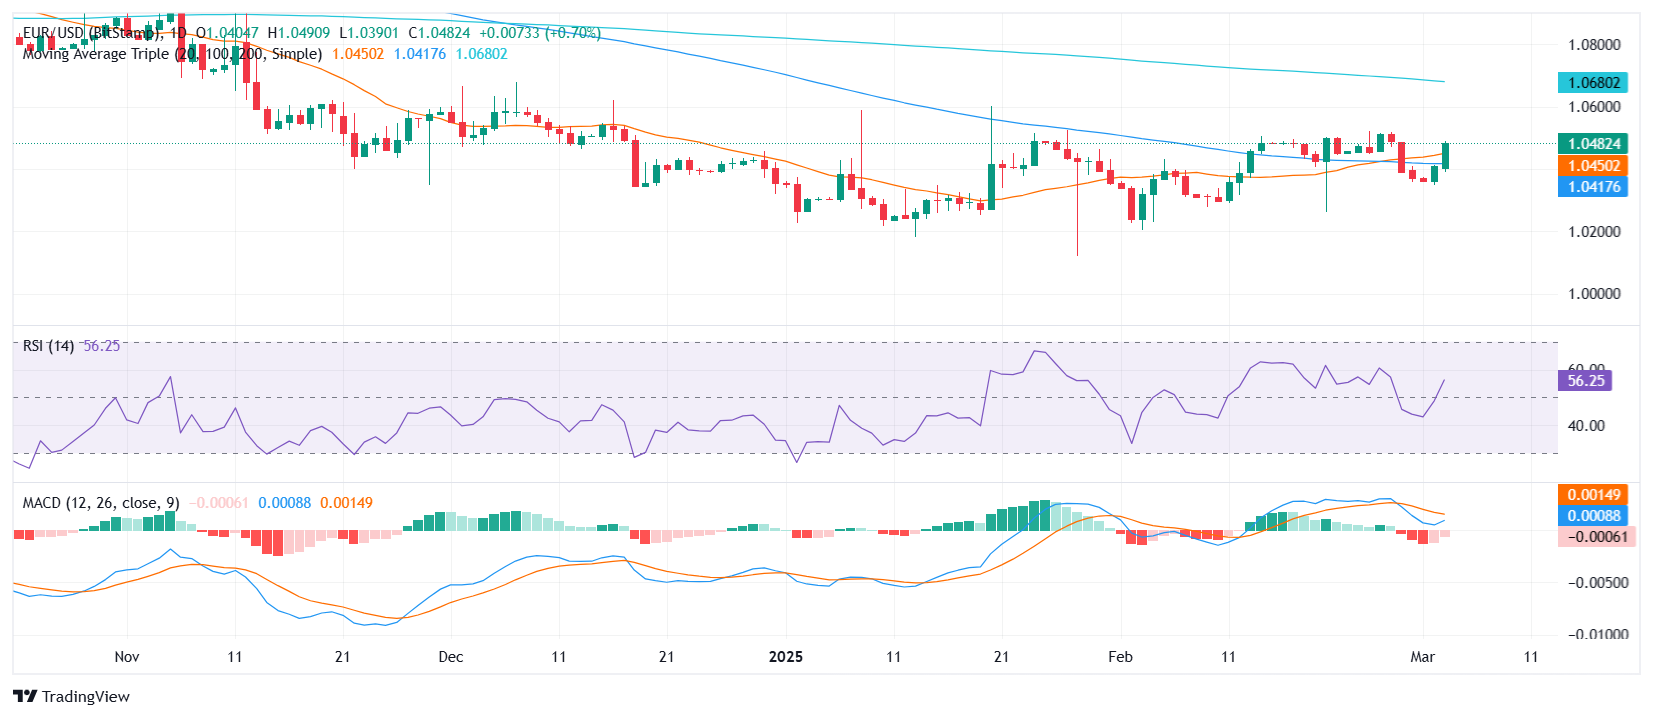
Technical indicators reflect this resurgence. The Relative Strength Index (RSI) is rising sharply in positive territory, confirming an increase in buying pressure. Meanwhile, the Moving Average Convergence Divergence (MACD) histogram shows decreasing red bars, hinting that while bullish momentum is strengthening, some consolidation could still take place before another push higher.

Looking ahead, immediate resistance is now located at 1.0520, a level that, if breached, could accelerate gains toward 1.0560. On the downside, support is found at 1.0450, which coincides with the recently broken moving averages. A drop below this level would weaken the bullish outlook and bring 1.0400 into focus.

EUR/USD daily chart

Author

Patricio Martín

Patricio is an economist from Argentina passionate about global finance and understanding the daily movements of the markets.

More from Patricio Martín
Share:

Editor's Picks

AUD/USD eyes 0.7150 barrier nine-day EMA

AUD/USD inches higher after registering modest losses in the previous day, trading around 0.7130 during the Asian hours. The technical analysis of the daily chart indicates that the pair is moving sideways within the rectangle pattern, suggesting a consolidation as neither the bulls nor the bears have enough momentum to take control of the market.

USD/JPY trades below 160.00 intervention threshold; bullish bias intact

The USD/JPY pair attracts some sellers during the Asian session amid fears that authorities will step in again to prop up the Japanese Yen. Furthermore, the Israel-Lebanon truce prompts some profit-taking around the US Dollar and exerts downward pressure on the currency pair.

Gold defends 200-day SMA at $4,425, but for how long?

Gold is attempting a tepid recovery toward $4,500 early Thursday, as renewed optimism in the Mideast geopolitical front calms market nerves. This cautious optimism across Asian markets weighs on Oil prices, and diminishes the US Dollar’s safe-haven appeal, helping Gold stage a decent comeback from the weekly low of $4,424.


Hyperliquid: ETF demand, capital rotation fuel HYPE rally as Bitcoin melts

Hyperliquid price sustains an upward trend near its all-time high of $75.76 on Thursday after posting 80% gains in May, while Bitcoin (BTC) retraces below $65,000, triggering a market-wide panic.

Kevin Warsh takes the Fed helm: What it means for the US Dollar
The Federal Reserve moves away from the highly predictable "forward guidance" model of the Jerome Powell era to a new “Kevin Warsh environment”, characterized by less communication, more policy surprises, and an increased focus on the Fed's complex balance sheet.
Recession on paper: What really moves the Canadian Loonie now?

Statistics Canada handed the headline writers a gift and the analysts a headache. Real GDP shrank 0.1% on an annualized basis in the first quarter, and with the fourth quarter of 2025 revised down to a 1.0% contraction, that is two negative quarters in a row, the textbook definition of a technical recession and Canada's first since the pandemic.