|

EUR/USD Price Analysis: Bulls on steroids as Fed’s rate hike in July to be last nail in coffin

  • EUR/USD has demonstrated a stellar run to near 1.1150 amid an intense sell-off in the USD Index.
  • After a soft US inflation report, hopes for only one interest rate hike this year by the Fed have improved.
  • EUR/USD is gathering strength for delivering a breakout of the slightly rising channel pattern.

The EUR/USD pair is consistently moving north with sheer momentum as soft United States Consumer Price Index (CPI) data drummed that only one interest rate hike option has left in the toolkit of the Federal Reserve (Fed) by year-end. The major currency pair has climbed to near 1.1150 as the US Dollar Index (DXY) is facing winter and the market mood is quite cheerful.

US monthly headline and core inflation registered a moderate pace of 0.2% in June along with a significant decline in annualized numbers due to falling prices of second-hand motor vehicles. The US Dollar Index (DXY) has shown a vertical fall to near 101.40 and is expected to continue its downside momentum.

Meanwhile, the European Central Bank (ECB) is expected to raise interest rates further to tame stubborn inflation. ECB President Christine Lagarde has already made clear that more interest rates are appropriate.

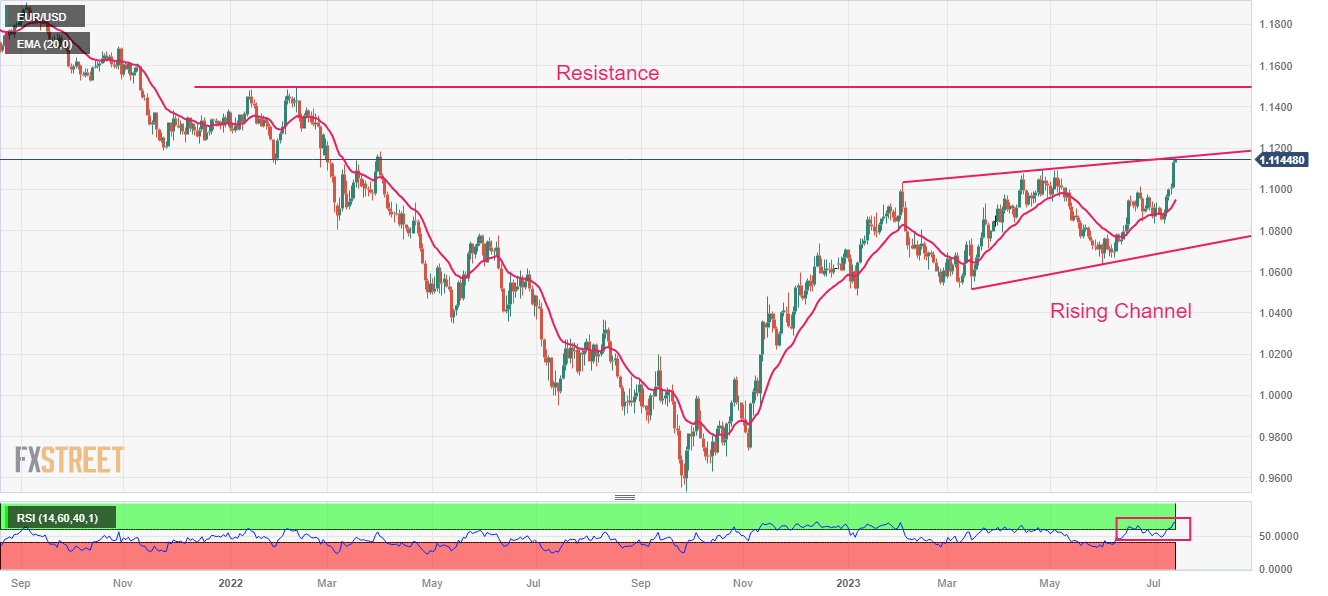
EUR/USD is gathering strength for delivering a breakout of the slightly rising channel formed on a daily scale. The upper portion of the aforementioned chart pattern is placed from February 03 high at 1.1033 while the lower portion is plotted from March 15 low at 1.0516. Potential resistance is placed from 14 January 2022 high at 1.1483.

Upward-sloping 20-period Exponential Moving Average (EMA) at 1.0947 indicates that the short-term trend is bullish.

The Relative Strength Index (RSI) (14) has jumped into the bullish range of 60.00-80.00, which indicates that the upside momentum has been activated.

For further upside, a decisive break above the round-level resistance of 1.1200 would expose the asset to 01 March 2022 high at 1.1233 followed by 25 February 2022 high at 1.1271.

In an alternate scenario, a downside move below February 03 high at 1.1033 would expose the asset to the psychological support of 1.1000. Further slippage below the psychological support would drag the major currency pair to June 15 high at 1.0953.

EUR/USD daily chart

EUR/USD

Overview
Today last price1.1141
Today Daily Change0.0010
Today Daily Change %0.09
Today daily open1.1131
 
Trends
Daily SMA201.0938
Daily SMA501.0861
Daily SMA1001.0841
Daily SMA2001.0638
 
Levels
Previous Daily High1.114
Previous Daily Low1.1005
Previous Weekly High1.0973
Previous Weekly Low1.0834
Previous Monthly High1.1012
Previous Monthly Low1.0662
Daily Fibonacci 38.2%1.1089
Daily Fibonacci 61.8%1.1057
Daily Pivot Point S11.1044
Daily Pivot Point S21.0956
Daily Pivot Point S31.0908
Daily Pivot Point R11.1179
Daily Pivot Point R21.1228
Daily Pivot Point R31.1315

Author

Sagar Dua

Sagar Dua

FXStreet

Sagar Dua is associated with the financial markets from his college days. Along with pursuing post-graduation in Commerce in 2014, he started his markets training with chart analysis.

More from Sagar Dua
Share:

Editor's Picks

EUR/USD holds ground near 1.1550 ahead of US Inflation data

EUR/USD is holding ground at around 1.1550 in the European session on Wednesday. The pair takes advantage of the profit-taking pullback in the US Dollar as traders reposition ahead of the critical US CPI inflation data. However, any upside attempts could be limited amid renewed US-Iran tensions.

GBP/USD keeps range near 1.3400, with eyes on US CPI

GBP/USD clings to minor recovery gains near 1.3400 in Wednesday's European trading, though it remains in a familiar range heading into the US CPI event risk. Traders keep an eye on developments around the Middle East crisis, which could ramp up volatility in the major.

Gold languishes near March low, below $4,200 as traders await US CPI report

Gold maintains its heavily offered tone through the first half of the European session and currently trades near its lowest level since March 23, around the $4,180-$4,175 region. Renewed hostilities between the US and Iran fuel inflationary concerns and bolster bets for more hawkish central banks.

Cardano's downtrend deepens despite on-chain bottoming signals

Cardano edges lower to $0.1600 signaling a potential extension of the 30% loss from last week. The altcoin remains under intense selling pressure, weighing on its retail support. Still, a spike in dormant supply re-entering circulation signals that the selling pressure has run its course, a pattern that often precedes a rebound.

US CPI data set to show inflation at three-year high in May, backing Fed hawkish tilt

The US Bureau of Labor Statistics will publish the May Consumer Price Index (CPI) data on Wednesday. The report is expected to show another step up in consumer inflation, driven by the persistently high Oil prices due to the ongoing crisis in the Middle East.

The US economy defies the rules: 100 days into the Oil shock and the recession signal is still missing

More than three months after the start of the Iran war and the resulting disruption to global energy markets, the US economy continues to display remarkable resilience. The conflict has triggered a sharp rise in Oil prices, reignited inflationary pressures and fueled widespread concerns about a potential economic slowdown.