EUR/USD Price Analysis: Bulls flirt with 100-day SMA hurdle, not out of the woods yet
- EUR/USD attracts buyers for the third straight day and climbs to a fresh weekly top.
- A combination of factors undermines the USD and acts as a tailwind for the major.
- ECB rate cut bets might cap gains amid a bearish technical setup on the daily chart.

The EUR/USD pair builds on this week's recovery move from the 1.0720-1.0725 region, or its lowest level in almost three months and gains positive traction for the third successive day on Thursday. The momentum lifts spot prices to a fresh weekly top, closer to the 1.0800 mark during the Asian session and is sponsored by a modest US Dollar (USD) weakness.
A slew of influential Federal Reserve (Fed) officials recently tempered market expectations for early interest rate cuts, which remains supportive of elevated US Treasury bond yields. That said, the markets are still pricing in five rate cuts over the course of the Fed’s seven remaining meetings this year. This, along with a generally positive risk tone, undermines the safe-haven buck, which, in turn, is seen as a key factor pushing the EUR/USD pair higher.
The USD bears, however, refrain from placing aggressive bets and prefer to wait for more cues about the likely timing and the pace of rate cuts in 2024. This, along with expectations that the European Central Bank (ECB) could start cutting interest rates by April amid falling inflation in the Eurozone, might cap gains for the EUR/USD pair. Hence, it will be prudent to wait for strong follow-through buying before confirming that spot prices have bottomed out.
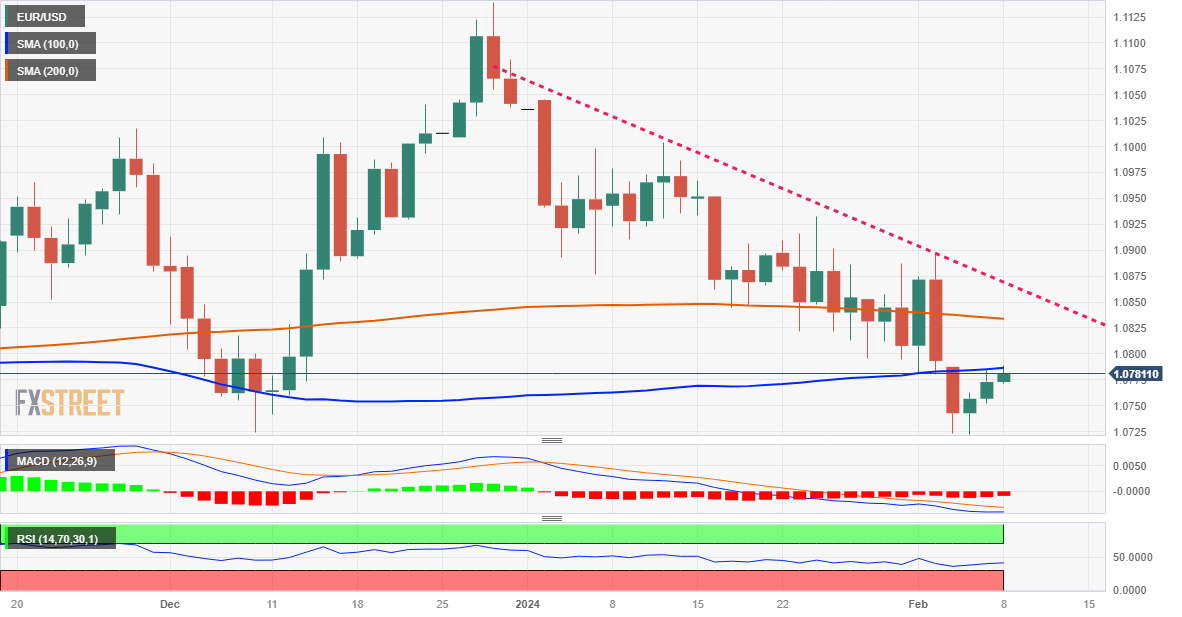
From a technical perspective, momentum beyond the 1.0800 mark is likely to meet with a fresh supply near the very important 200-day Simple Moving Average (SMA), currently pegged near the 1.0830-1.0835 region. This is closely followed by a one-month-old descending trend line, around mid-1.0800s, which if cleared decisively might shift the near-term bias in favour of bullish traders and prompt aggressive short-covering around the EUR/USD pair.
Spot prices might then aim to reclaim the 1.0900 round figure and extend the positive move further towards the next relevant hurdle near the 1.0920-1.0925 region. A sustained strength beyond the latter should pave the way for additional gains and lift the EUR/USD pair to the 1.1000 psychological mark.
On the flip side, the 1.0750-1.0745 zone is likely to protect the immediate downside ahead of the monthly low, around the 1.0725-1.0720 region and the 1.0700 mark. A convincing break below the latter will be seen as a fresh trigger for bearish traders and make the EUR/USD pair vulnerable to accelerate the slide further towards the 1.0665-1.0660 intermediate support en route to the 1.0620-1.0615 region and the 1.0600 round figure.
EUR/USD daily chart
Technical levels to watch
Author

Haresh Menghani
FXStreet
Haresh Menghani is a detail-oriented professional with 10+ years of extensive experience in analysing the global financial markets.


