EUR/USD Price Analysis: Bulls charge towards a critical weekly 50% mean reversion mile-stone
- EUR/USD staying the course, so far, towards a 50% mean reversion target area.
- However, the bearish head and shoulders are a topping pattern that currently features in the 15-min time frame.

As per the start of the week's analysis, EUR/USD Price Analysis: Bulls are taking over through key daily resistance, the price has continued higher as the bulls hunt down key weekly resistance structure.
Breaking daily resistance in the opening sessions on Monday, EUR/USD breached the 38.2% Fibonacci of the weekly bearish impulse on Monday and has subsequently moved higher into the 1.07 areas with eyes on mid-late April daily swing lows near 1.0770. The following illustrates the bullish bias over a series of time frames.
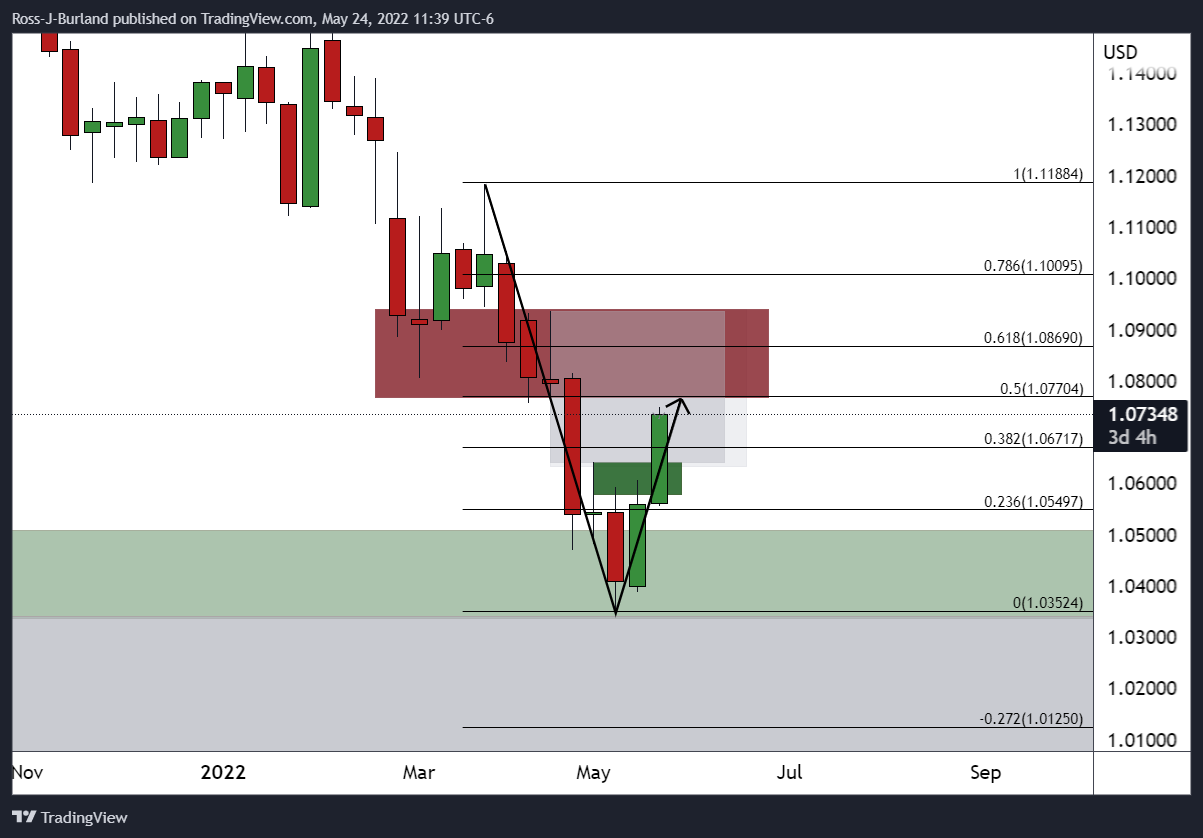
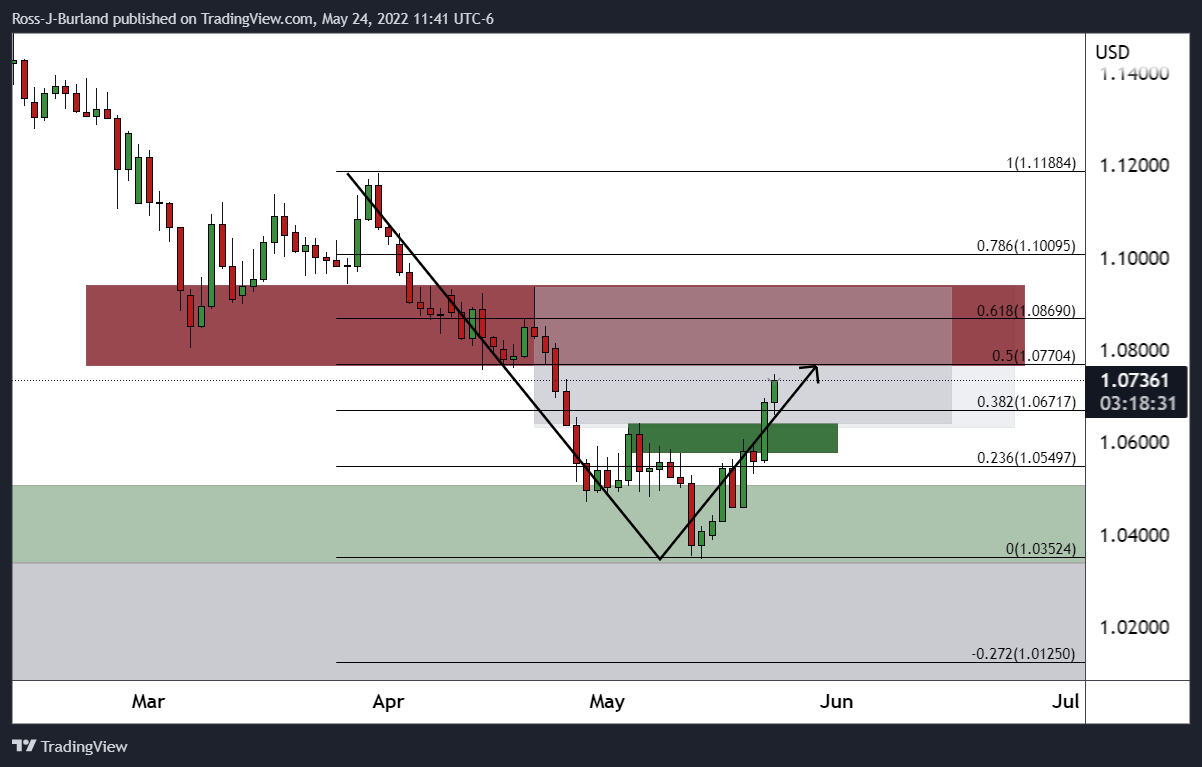
EUR/USD weekly/daily charts, prior analysis
It was stated that ''the bulls are already penetrating the 38.2% Fibonacci and on the way to 1.07 the figure. A move towards the 50% and 61.8% ratios could be on the cards for the foreseeable future.''
As for the daily chart, the analysis noted ''the price imbalance on the daily chart leaves the aforementioned weekly ratios on the Fibonacci scale exposed towards 1.0770 and 1.0936.''
EUR/USD live market
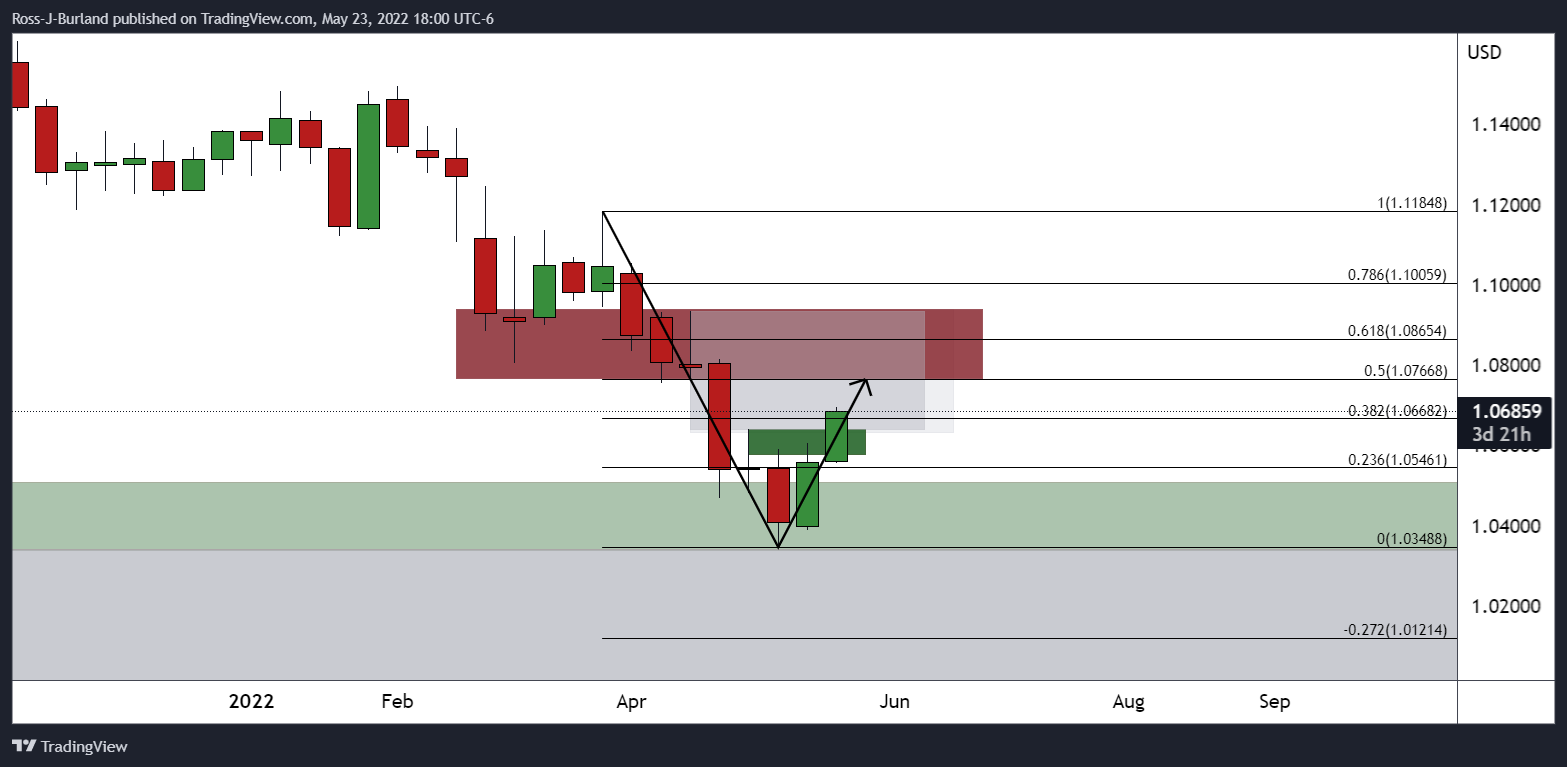
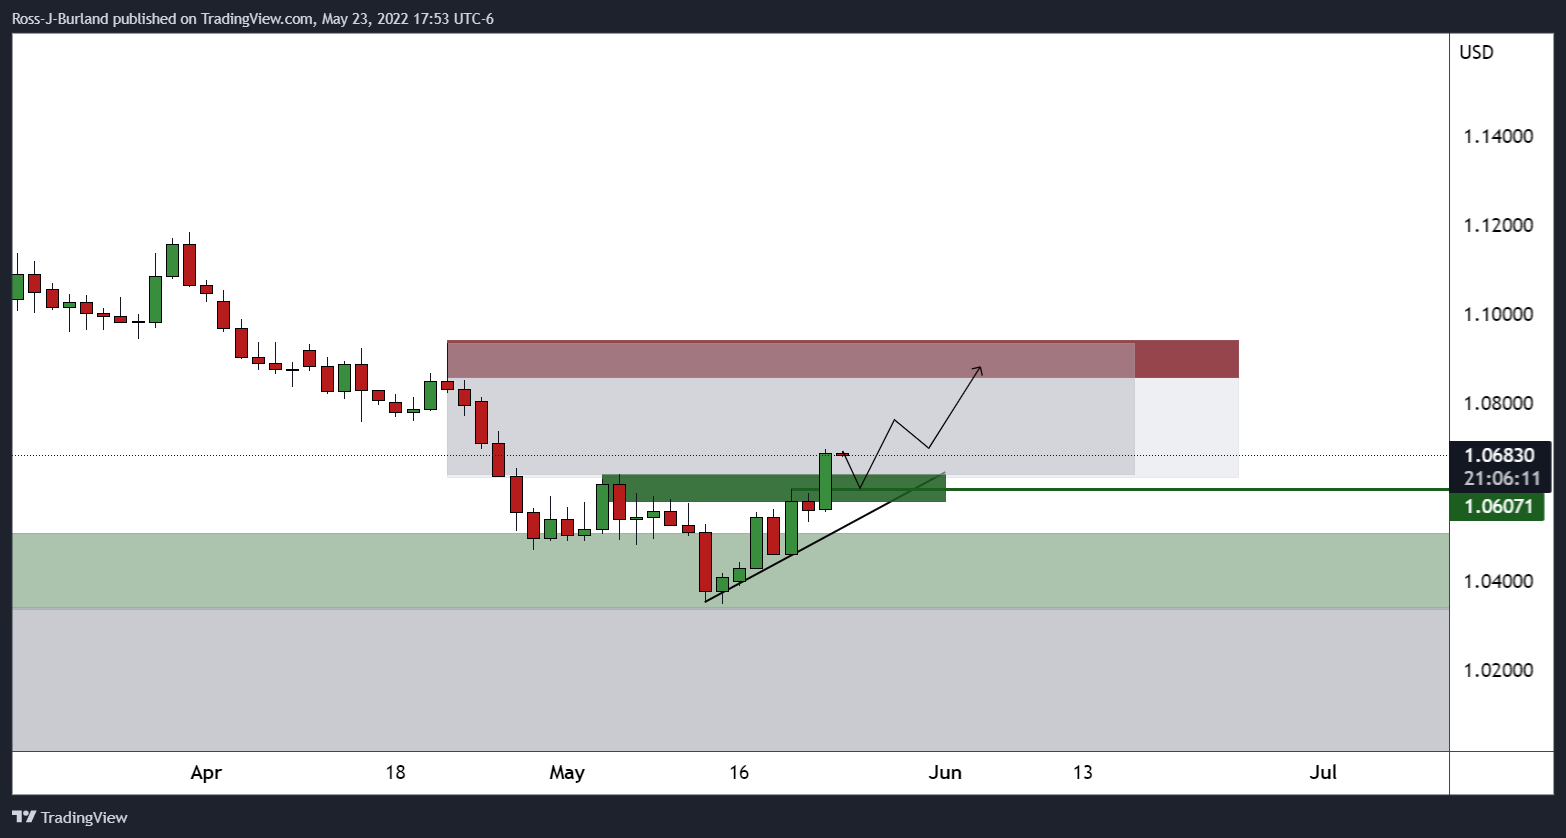
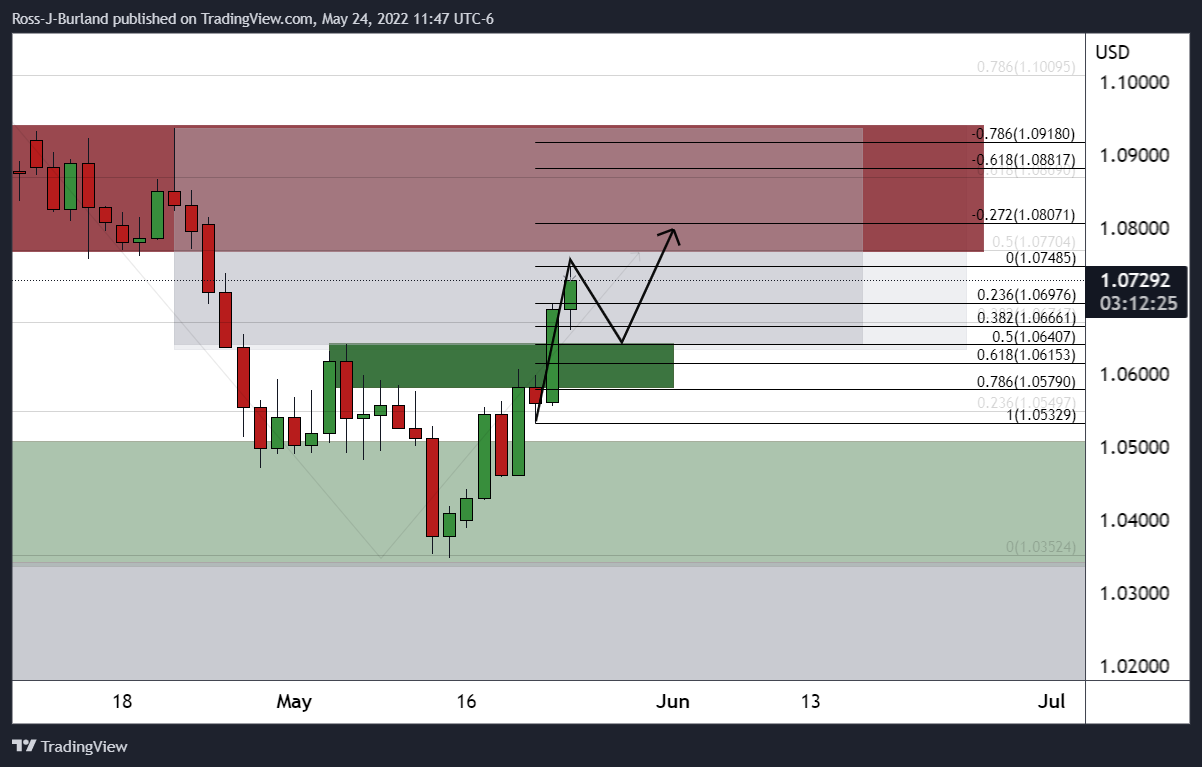
The price is moving in on the aforementioned weekly supply zone and prior daily swing lows:
However, at this juncture, the weekly W-formation should be noted:

This is a reversion pattern and the price would be expected to revisit the neckline in due course. In the meantime, the daily impulse could be due for a meanwhile correction also:
EUR/USD M15 chart
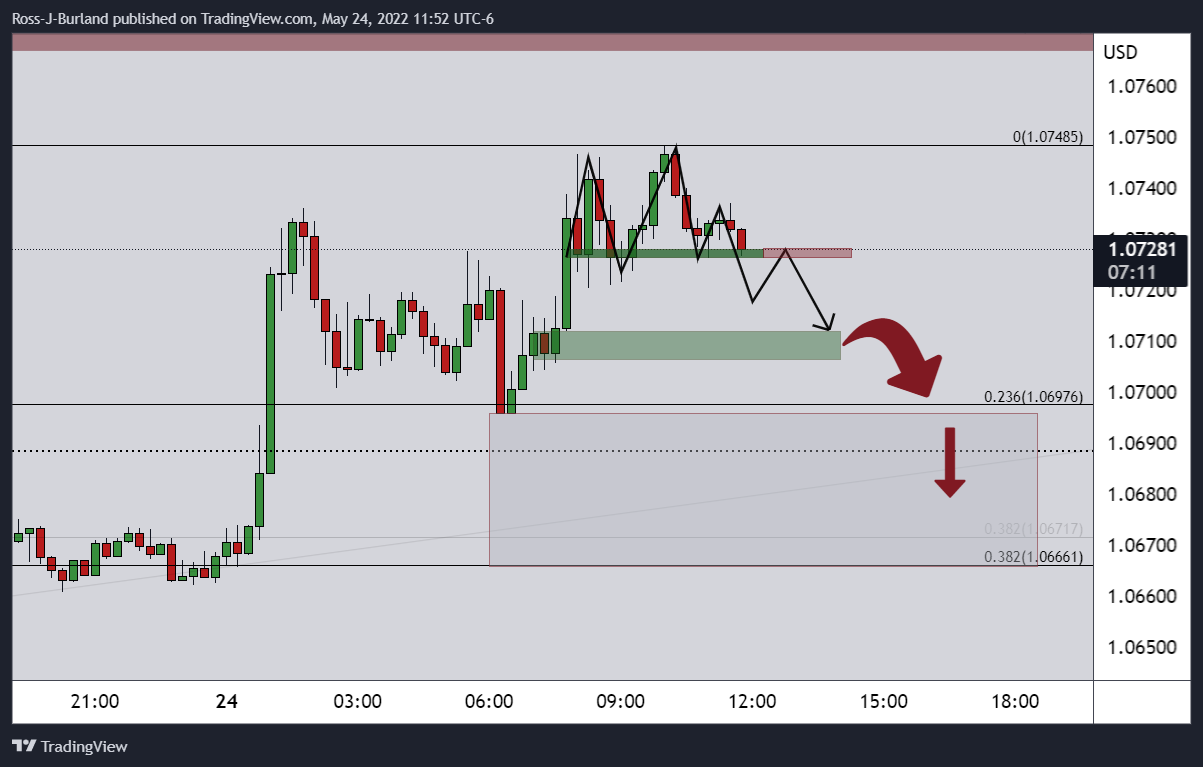
The bearish head and shoulders are a topping pattern that currently features in the 15-min time frame. A break of the neckline near 1.0725 could spell trouble for the committed bulls. A break of 1.0705 will likely open the way for further supply to mitigate the price imbalance towards a 38.2% Fibonacci retracement of the daily bullish breakout impulse near 1.0665 that guards a 50% mean reversion to 1.0640.
Author

Ross J Burland
FXStreet
Ross J Burland, born in England, UK, is a sportsman at heart. He played Rugby and Judo for his county, Kent and the South East of England Rugby team.


