|

EUR/USD Price Analysis: Bulls charge and draw an inverse H&S on daily chart

  • EUR/USD has burst to life leaving an inverse H&S on the daily chart.
  • The hourly 38.2% Fibonacci, 50% mean reversion and 61.8% ratio could be an area of support in the coming sessions.

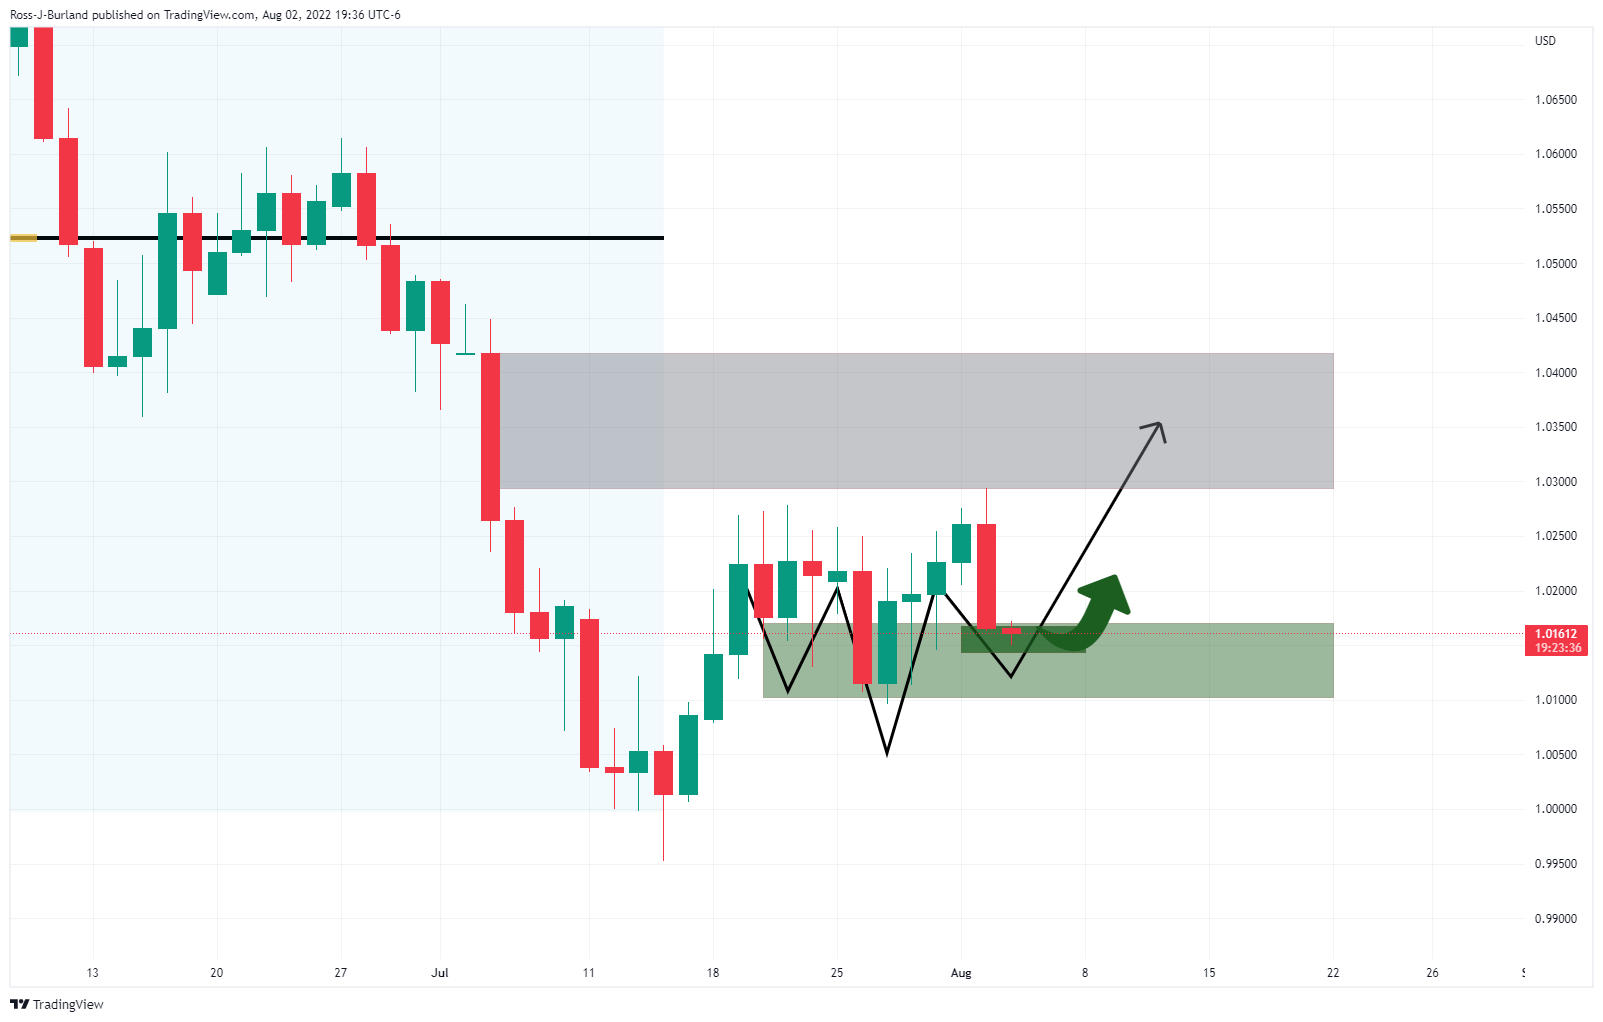
As per the prior analysis, EUR/USD Price Analysis: Bulls eye a break of 1.0171 structure, the bulls have taken control and rallied all the way to 1.0253. 

The prior analysis said the bullish correction could eventually result in an upside continuation leaving behind the outcome of an inverted head and shoulders.

EUR/USD daily chart, prior analysis

EUR/USD live market

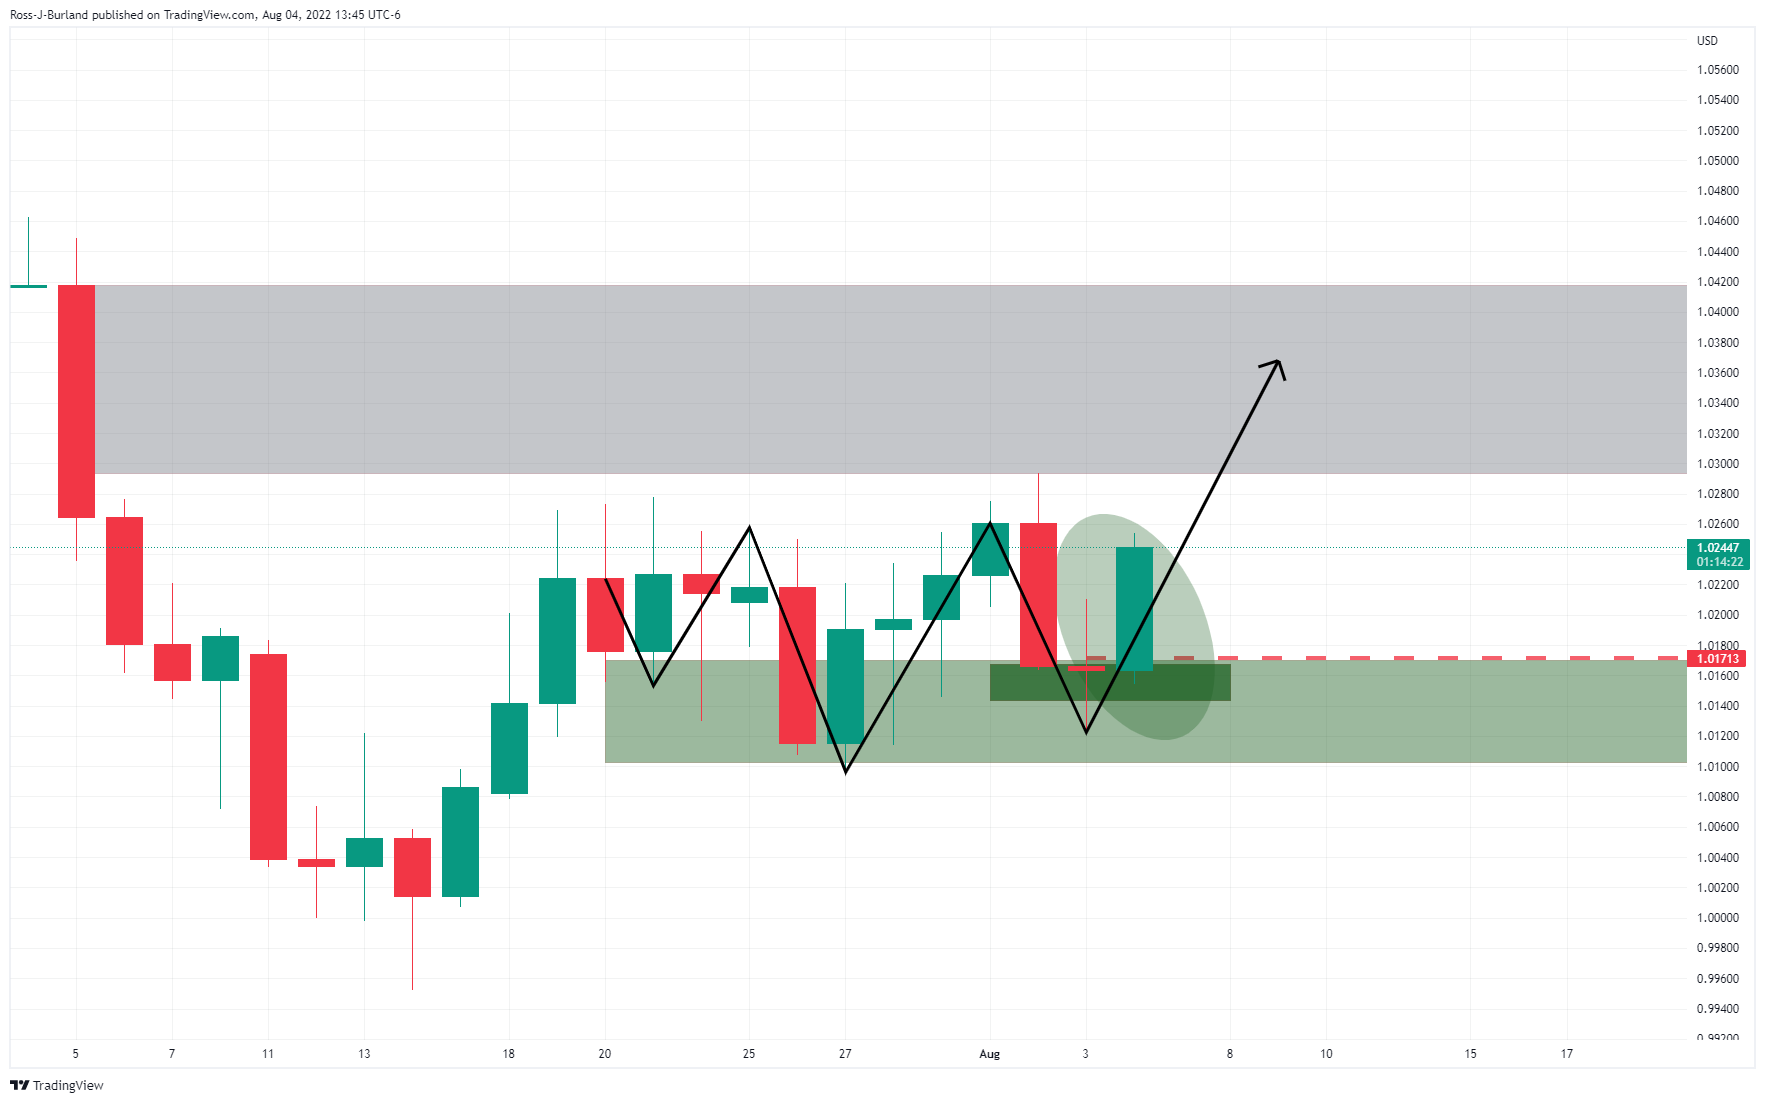
The price has moved higher as anticipated and there are prospects of a move into the greyed area in the forthcoming days. The bulls will need to overcome the resistance, however between 1.0250 and 1.0300. At this juncture, a pull back on the houly time frame is probable:

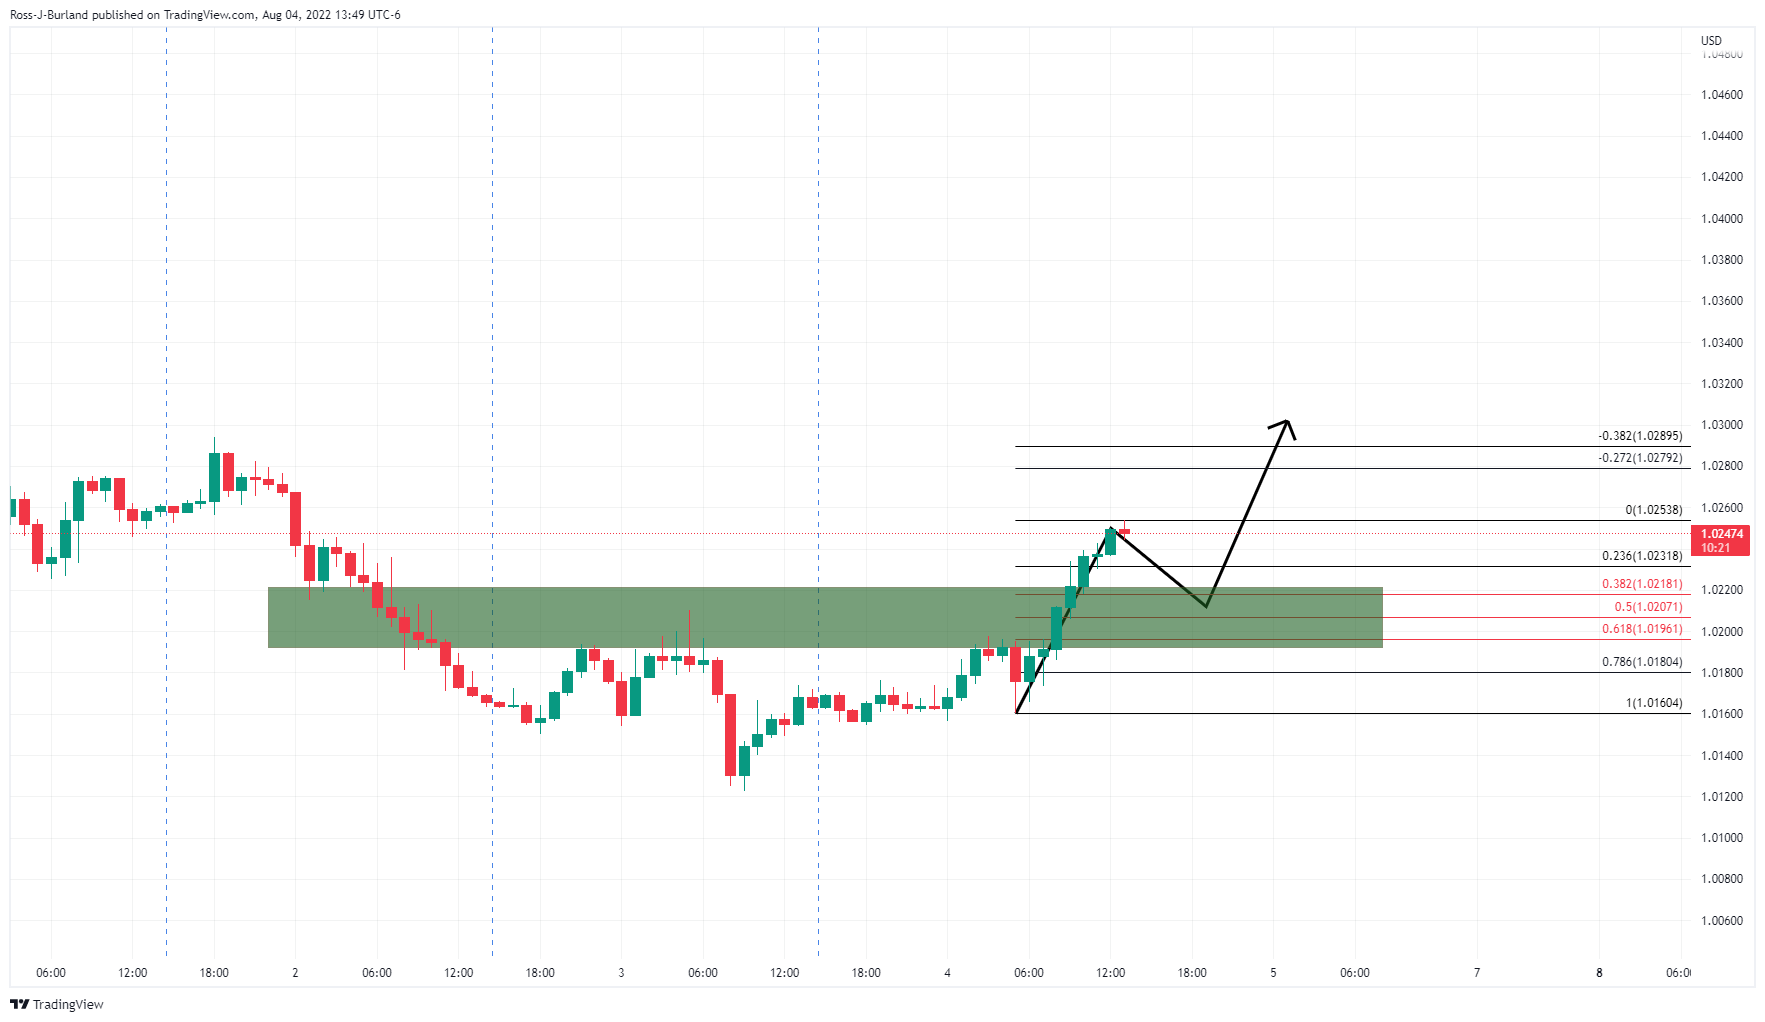
The 38.2% Fibonacci, 50% mean reversion and 61.8% ratio could be an area of support in the coming sessions and in the countdown to the Nonfarm Payrolls event to end the week.

Author

Ross J Burland

Ross J Burland, born in England, UK, is a sportsman at heart. He played Rugby and Judo for his county, Kent and the South East of England Rugby team.

More from Ross J Burland
Share:

Editor's Picks

EUR/USD slumps below 1.1750 as USD benefits from risk-aversion

EUR/USD comes under renewed bearish pressure in the European session and trades below 1.1750 following a recovery attempt earlier in the day. The US Dollar gathers strength and weighs on the pair as investors seek refuge in the wake of Israel and the United States' joint attack on Iran.

GBP/USD targets 1.3500 barrier near moving averages

GBP/USD rebounds from the daily losses, trading around 1.3450 during the Asian hours on Monday. The technical analysis of the daily chart indicates an ongoing bearish bias, as the pair trades within a descending channel pattern.

Gold surges on safe-haven demand, tests $5,400

Gold benefits from intense risk-aversion on Monday and climbs to the $5,400 region, setting a fresh monthly-high in the process. Tensions in the Middle East remain high as Israel and Hezbollah continue to exchange strikes following the US-Israel joint attack on Iran over the weekend.

Bitcoin on brink of breakdown amid US-Iran war

Bitcoin (BTC) remains under pressure near the key support level of $65,700. Trading at $66,400 at the time of writing on Monday, a breakdown below this critical level would suggest a deeper correction ahead.

The week ahead: Conflict in the Middle East jolts markets

Events in the Middle East are obviously dominating financial markets this morning. The Brent crude oil price is extending gains and is higher by more than 8%, stock futures are pointing lower and the gold price is higher by more than 2%. 

Pi Network Price Forecast: Core team offloads supply, weighing on PI recovery

Pi Network  hovers below $0.1700, broadly steady at press time on Monday, attempting a recovery after a 2% loss the previous day. Sunday’s decline aligned with nearly 49 million PI tokens offloaded by the Pi Foundation, implying a spike in supply pressure that capped the prevailing four-day recovery.