|

EUR/USD Price Analysis: Bulls battle 1.2100 on the way to key hurdles

  • EUR/USD wavers around two-month top after Friday’s heavy run-up.
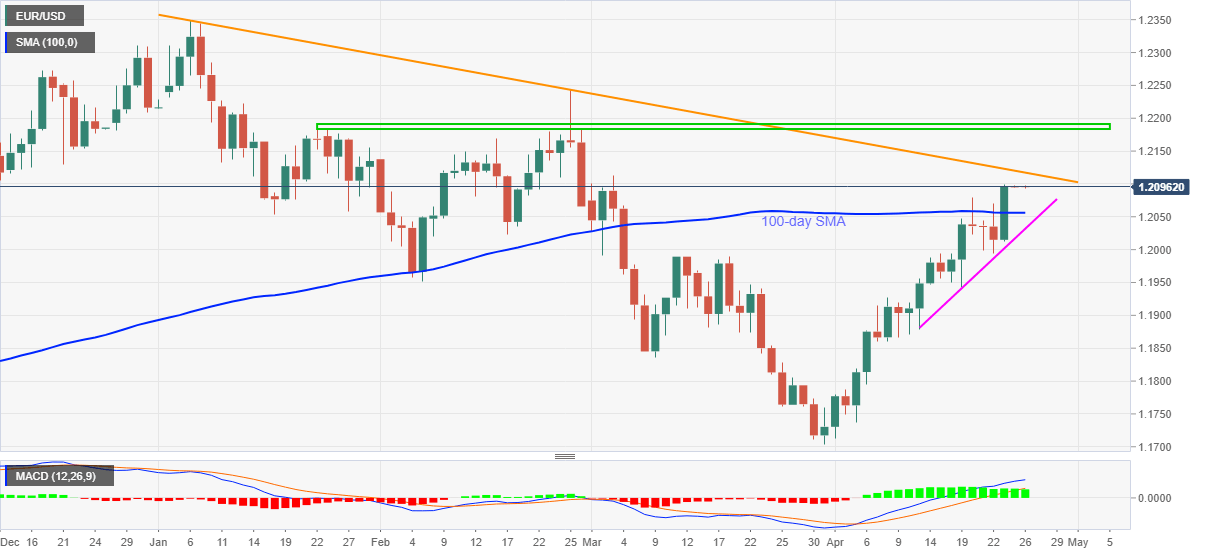
  • Successful break of 100-day SMA, bullish MACD suggest further upside.
  • March’s top, a descending trend line from early January test immediate rise.

EUR/USD bulls look for clear direction around early March top while taking rounds to 1.2100 during the initial Asian session on Monday.

In doing so, the key currency pair stays above 100-day SMA for the first time since March 04 after Friday’s notable upside moves, the heaviest since February 05.

Sustained trading beyond 100-day SMA also takes clues from bullish MACD to keep EUR/USD buyers hopeful.

It should, however, be noted that March month’s high near 1.2115 and a downward sloping trend line from January 06, around 1.2120, become decisive for the pair’s further upside.

Should the quote manages to remain strong above 1.2120, which is more likely, a horizontal area established from late January surrounding 1.2180–90 will be crucial to watch.

Meanwhile, pullback moves may eye the last week’s top near 1.2080 before retesting the 100-day SMA level of 1.2056.

If EUR/USD bears manage to sneak in below 1.2056, an ascending support line from April 13, around 1.2030, will be in the spotlight.

EUR/USD daily chart

Trend: Bullish

Additional important levels

Overview
Today last price1.2095
Today Daily Change-2 pips
Today Daily Change %-0.02%
Today daily open1.2097
 
Trends
Daily SMA201.1907
Daily SMA501.1956
Daily SMA1001.2056
Daily SMA2001.193
 
Levels
Previous Daily High1.21
Previous Daily Low1.2013
Previous Weekly High1.21
Previous Weekly Low1.1943
Previous Monthly High1.2113
Previous Monthly Low1.1704
Daily Fibonacci 38.2%1.2067
Daily Fibonacci 61.8%1.2046
Daily Pivot Point S11.204
Daily Pivot Point S21.1983
Daily Pivot Point S31.1953
Daily Pivot Point R11.2127
Daily Pivot Point R21.2157
Daily Pivot Point R31.2214

Author

Anil Panchal

Anil Panchal

FXStreet

Anil Panchal has nearly 15 years of experience in tracking financial markets. With a keen interest in macroeconomics, Anil aptly tracks global news/updates and stays well-informed about the global financial moves and their implications.

More from Anil Panchal
Share:

Editor's Picks

EUR/USD falls to near 1.1600 due to persistent bearish bias

EUR/USD depreciates after registering modest gains in the previous session, trading around 1.1610 during the Asian hours on Thursday. The technical analysis of the daily chart suggests a persistent bearish bias as the EUR/USD pair remains within the descending channel pattern.

GBP/USD underperforms as UK faces stagflation risks amid Middle East war

The Pound Sterling trades lower against its major currency peers, is down 0.22% around 1.3340 against the US Dollar, during the Asian trade on Thursday. The British currency faces selling pressures amid fears that the United Kingdom economy could face stagflation risks due to higher energy prices, a situation in which inflation accelerates with economic growth and employment conditions remaining stagnant.

Gold climbs near $5,200 as Iran war fuels safe-haven demand

Gold price extends its gains for the second successive session on Thursday as traders seek safety amid the ongoing war in the Middle East. US and Israeli strikes across Iranian territory and widespread Iranian missile and drone retaliation across the Middle East, including attacks on regional targets and military sites, prolong the crisis and its impact.

Top Crypto Gainers: Decred, Zcash, and Dogecoin lead recovery as Bitcoin crosses $72,000

Bitcoin trades above $72,500 at press time on Thursday, holding its 6% gain from the previous day, contributing to a broader market recovery. The total cryptocurrency market capitalization stands at over $2.43 trillion as the broader market sentiment improves significantly.

First Venezuela, now Iran: The US-China energy war escalates

At first glance, the latest escalation involving the United States with both Iran and Venezuela looks like another chapter in a long-running geopolitical story. But viewed through a broader strategic lens, something else may be unfolding: Energy.

Cardano Price Analysis: Approaches key trendline amid bearish sentiment

Cardano (ADA) price is approaching its descending trendline around $0.28 at the time of writing, set to shape the next directional move. The derivatives metrics paint a bearish picture, with ADA’s Open Interest continuing to fall and short bets rising among traders.