EUR/USD Price Analysis: Bulls await a breakout through two-month-old descending trend-line
- EUR/USD oscillates in a narrow band below a two-month-old descending trend-line hurdle.
- The emergence of some buying around the USD is seen as a key factor acting as a headwind.
- The technical setup still favours bullish traders and supports prospects for additional gains.

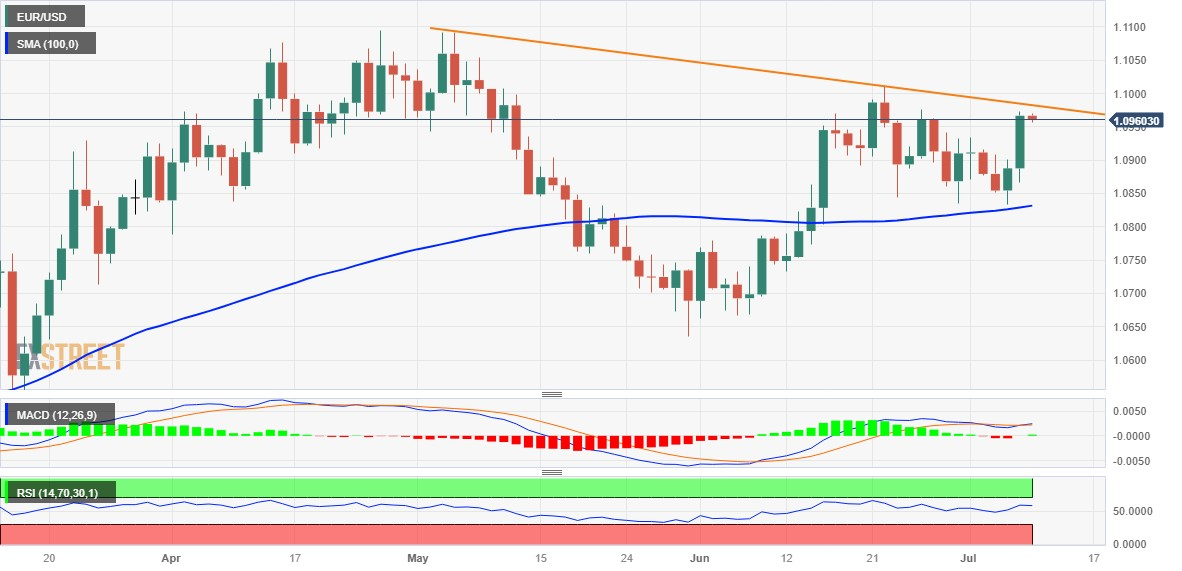
The EUR/USD pair struggles to capitalize on last week's solid bounce from the vicinity of the 100-day Simple Moving Average (SMA) support near the 1.0830 area and remains on the defensive through the Asian session on Monday. The pair is currently trading just above mid-1.0900s, down less than 0.10% for the day, and is pressured by the emergence of some US Dollar (USD) buying.
In fact, the USD Index (DXY), which tracks the Greenback against a basket of currencies, recovers a part of Friday's steep post-NFP decline to its lowest level since June 22 and draws support from elevated US Treasury bond yields. Despite the rather unimpressive US monthly jobs report, investors seem convinced that the Federal Reserve (Fed) will hike interest rates later this month. This allows the yield on the rate-sensitive two-year US government bond to stand tall near its highest since June 2007. Moreover, the benchmark 10-year US Treasury yield holds steady above the 4.0% threshold and helps revive the USD demand.
Market participants, however, seem convinced that the US central bank will soften its hawkish stance after the expected lift-off in July, which, in turn, is holding back the USD bulls from placing aggressive bets. The shared currency, on the other hand, remains well supported by a more hawkish commentary by several European Central Bank (ECB) policymakers recently, backing the case for additional rate hikes in July and September meetings. This, in turn, is seen acting as a tailwind for the EUR/USD pair and limiting the downside, warranting some caution for aggressive traders and before positioning for any meaningful fall.
Meanwhile, technical indicators on the daily chart are holding in the positive territory and support prospects for a further near-term appreciating move. Bulls, however, might wait for a convincing breakout through a descending trend-line hurdle extending from the May swing high, currently around the 1.0980-1.0985 area, above which the EUR/USD pair could retest the June swing high, around the 1.1010 zone. Some follow-through buying has the potential to lift spot prices further towards the 1.1050-1.1060 resistance en route to the next relevant strong barrier, just ahead of the 1.1100 mark, which should act as a pivotal point.
On the flip side, the 1.0930 area now seems to protect the immediate downside ahead of the 1.0900 round figure. Failure to defend the said support levels might negate the positive outlook and make the EUR/USD pair vulnerable to accelerate the slide back towards challenging the 100-day SMA support, currently around the 1.0830 region. This is followed by the 1.0800 mark, below which spot prices could accelerate the fall towards the 1.0760 horizontal support before dropping to the 1.0700 round-figure mark.
EUR/USD daily chart
Key levels to watch
Author

Haresh Menghani
FXStreet
Haresh Menghani is a detail-oriented professional with 10+ years of extensive experience in analysing the global financial markets.


