|

EUR/USD Price Analysis: Bears take on deeper demand territory below 1.2000

  • EUR/USD bears reach the monthly downside support structure.
  • Bears will need to convincingly break two critical layers of support. 

As per the prior analysis, The Chart of the Week: EUR/USD enters the bear's lair, the price has indeed continued to the monthly support.

Prior analysis, Monthly charts

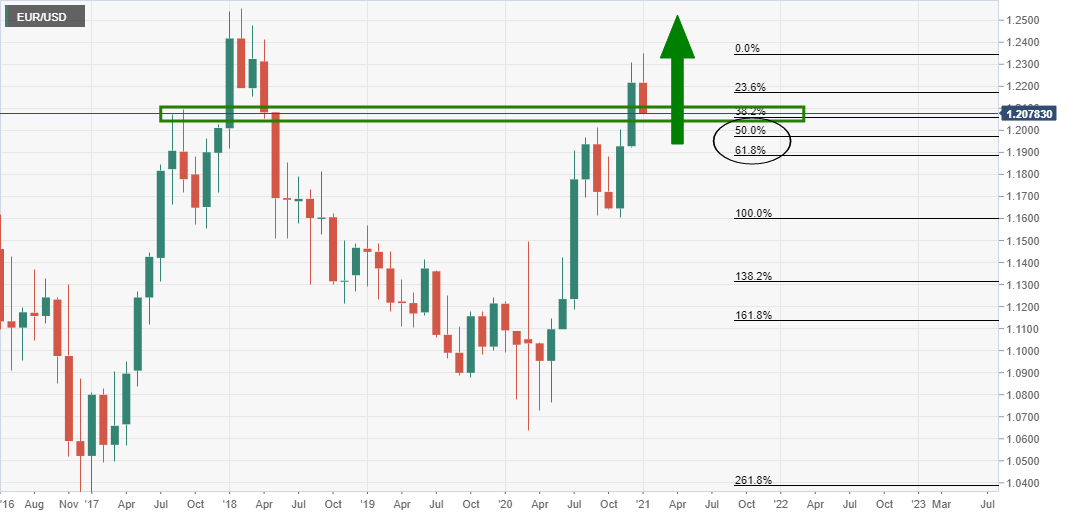
The monthly chart has corrected to a 38.2% Fibonacci retracement level, but there could still be some more room to go until the correction meets prior resistance.

In doing so, there will be a bearish prospect on the lower time frames before the bulls take back control.

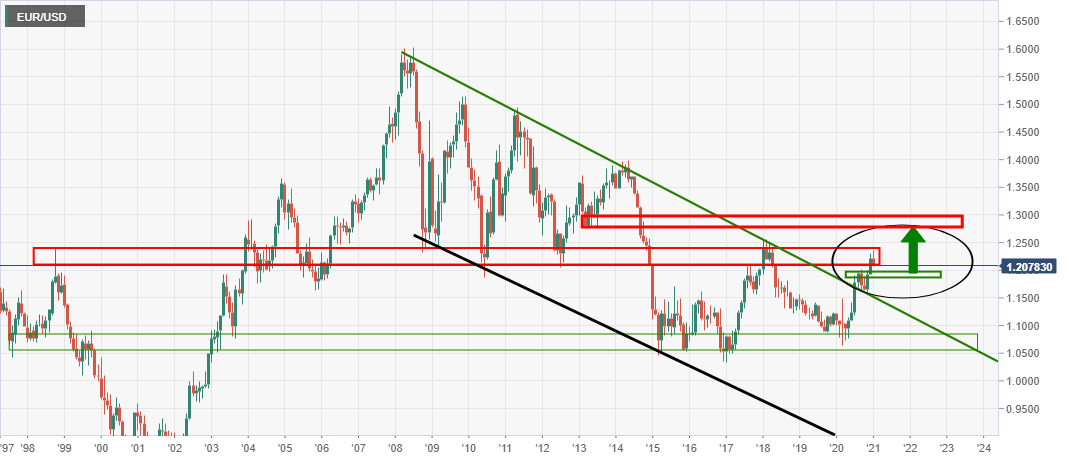
In the last chart above, it was illustrated that there would be expectations of an upside continuation from this juncture.

The following is a top-down analysis that brings us up to date with the latest price action.

Live markets, monthly chart

The price has retraced to the expected support zone which may now see the price stabilise before attempting to correct higher and even extend the upside. 
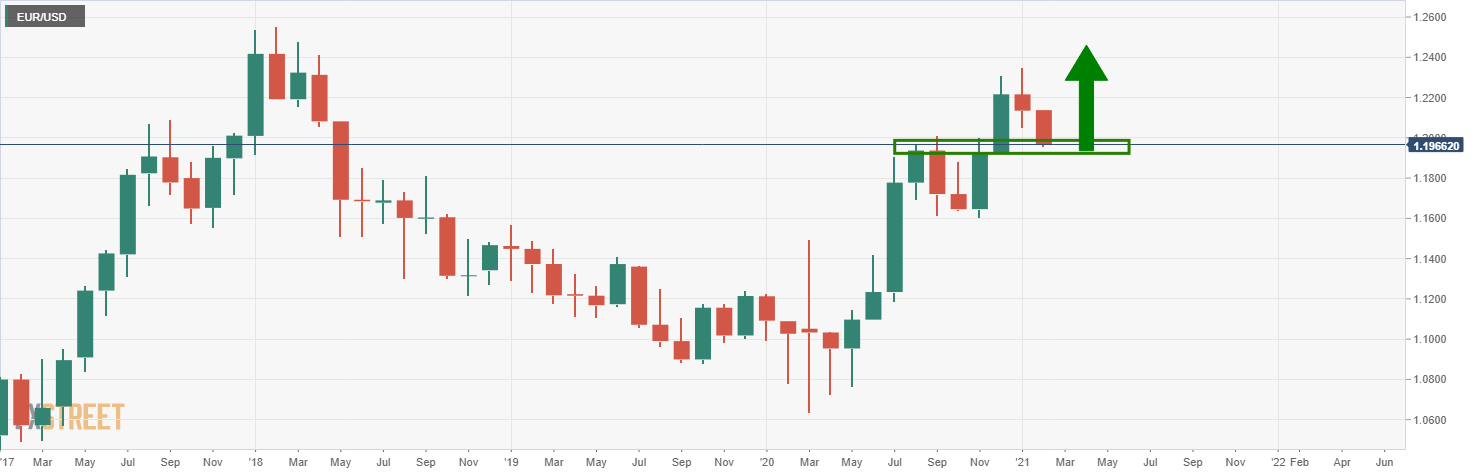
Weekly chart

The 61.8% Fibonacci retracement level on the weekly bullish impulse has been met in this supply and its confluence with prior resistance is compelling. 
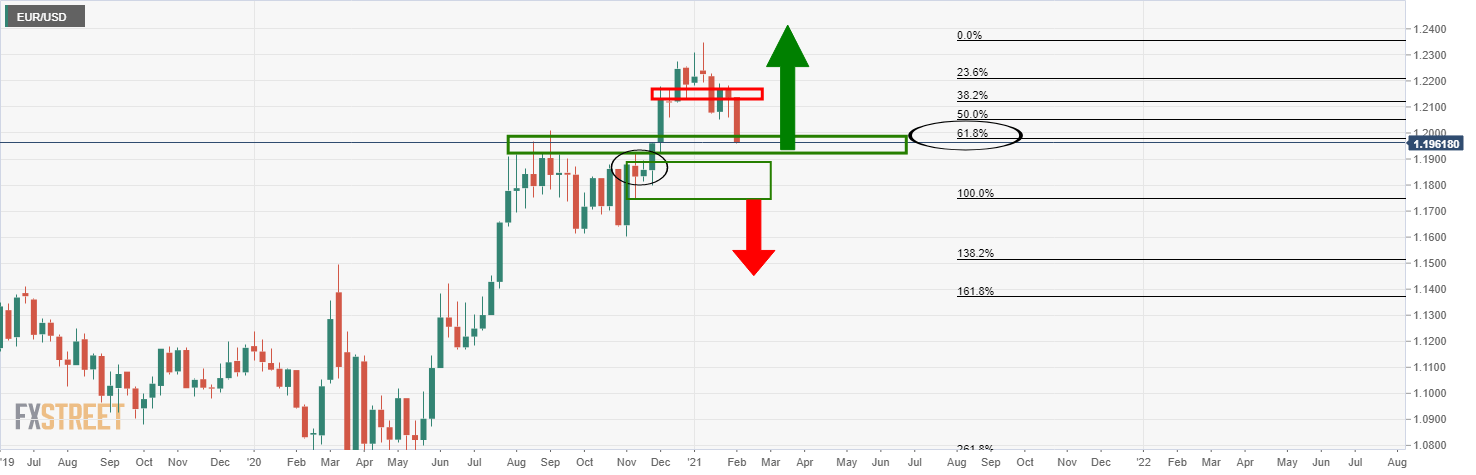
Daily chart

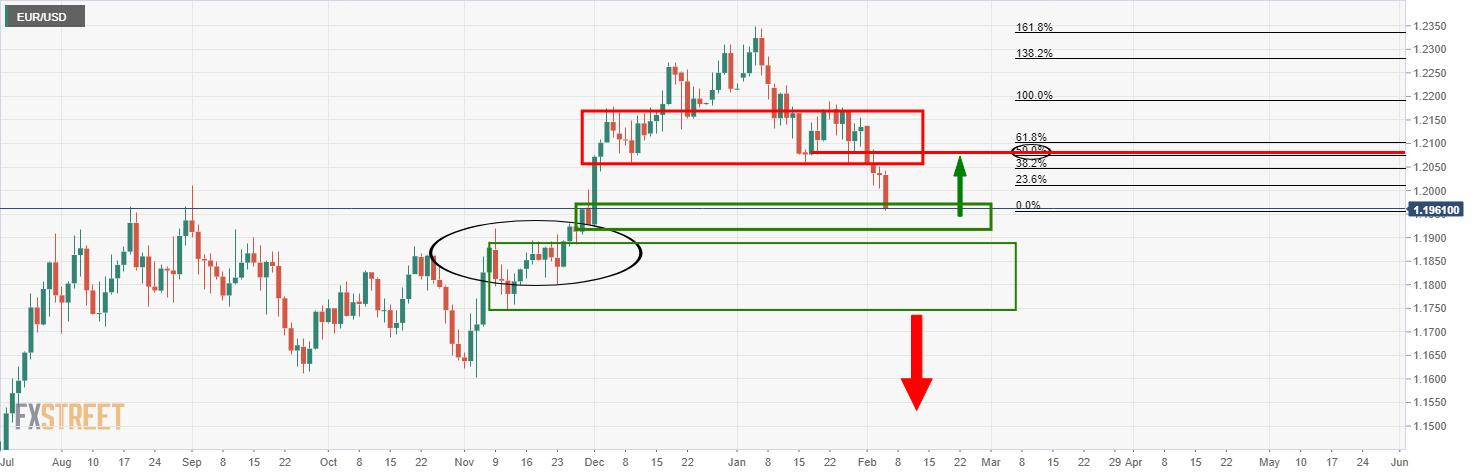
While there is every possibility of a downside continuation, a 50% mean reversion level meets prior support which may offer resistance if the price corrects higher from support. 

Only a break of ower structure would offer convincing downside potential. 

Author

Ross J Burland

Ross J Burland, born in England, UK, is a sportsman at heart. He played Rugby and Judo for his county, Kent and the South East of England Rugby team.

More from Ross J Burland
Share:

Editor's Picks

EUR/USD treads water above 1.1850 amid thin trading

EUR/USD stays defensive but holds 1.1850 amid quiet markets in the European hours on Monday.  The US Dollar is struggling for direction due to thin liquidity conditions as US markets are closed in observance of Presidents' Day. 

GBP/USD flat lines as traders await key UK and US macro data

GBP/USD kicks off a new week on a subdued note and oscillates in a narrow range near 1.365 in Monday's European trading. The mixed fundamental backdrop warrants some caution for aggressive traders as the market focus now shifts to this week's important releases from the UK and the US.

Gold sticks to intraday losses; lacks follow-through

Gold remains depressed through the early European session on Monday, though it has managed to rebound from the daily trough and currently trades around the $5,000 psychological mark. Moreover, a combination of supporting factors warrants some caution for aggressive bearish traders, and before positioning for deeper losses.

Bitcoin, Ethereum and Ripple consolidate within key ranges as selling pressure eases

Bitcoin and Ethereum prices have been trading sideways within key ranges following the massive correction. Meanwhile, XRP recovers slightly, breaking above the key resistance zone. The top three cryptocurrencies hint at a potential short-term recovery, with momentum indicators showing fading bearish signs.

Global inflation watch: Signs of cooling services inflation

Realized inflation landed close to expectations in January, as negative base effects weighed on the annual rates. Remaining sticky inflation is largely explained by services, while tariff-driven goods inflation remains limited even in the US.

Ripple Price Forecast: XRP potential bottom could be in sight

Ripple edges up above the intraday low of $1.35 at the time of writing on Friday amid mixed price actions across the crypto market. The remittance token failed to hold support at $1.40 the previous day, reflecting risk-off sentiment amid a decline in retail and institutional sentiment.