|

EUR/USD Price Analysis: Bears take a breather ahead of 1.1300 key support

  • EUR/USD holds lower grounds at weekly bottom after the biggest daily loss in two weeks.
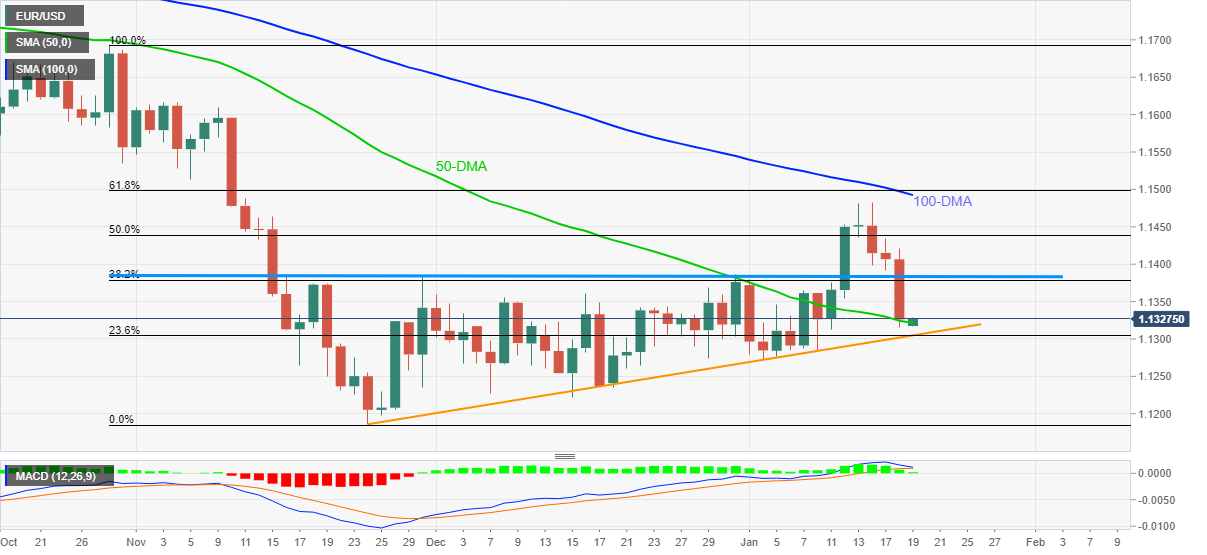
  • 50-DMA, two-month-old rising support line confine further declines.
  • Clear break of horizontal area from November, MACD conditions keeps sellers hopeful.
  • Buyers remain away until the quote stays below 100-DMA.

EUR/USD seesaws around 1.1320-25 during early Wednesday morning in Asia, having dropped the most in 12 days the previous day.

The major currency pair’s slump on Tuesday dragged MACD towards teasing the bears while breaking a two-month-long resistance-turned-support area of around 1.1380-85.

However, the 50-DMA level surrounding 1.1325 restricts the EUR/USD pair’s immediate declines ahead of an upward sloping support line from late November, close to 1.1300 at the latest.

Given the MACD conditions and a clear break of the key supports, EUR/USD prices are likely to conquer the 1.1300 support line, which in turn could drag the quote towards the 2021 bottom surrounding 1.1185.

During the fall, the 1.1230 and the 1.1200 threshold may offer an intermediate halt.

On the contrary, corrective pullback remains elusive below the horizontal area from November 16, near 1.1380-85.

Following that, the 50% Fibonacci retracement (Fibo.) level of October-November 2021 downside, near 1.1440, will test the EUR/USD buyers.

Even if the pair prices rise beyond 1.1440, 100-DMA and 61.8% Fibo. level, respectively around 1.1490 and 1.1500, will be tough resistances to break for the bulls.

EUR/USD: Daily chart

Trend: Further weakness expected

Additional important levels

Overview
Today last price1.1325
Today Daily Change-0.0082
Today Daily Change %-0.72%
Today daily open1.1407
 
Trends
Daily SMA201.1346
Daily SMA501.133
Daily SMA1001.1502
Daily SMA2001.1729
 
Levels
Previous Daily High1.1434
Previous Daily Low1.1392
Previous Weekly High1.1483
Previous Weekly Low1.1285
Previous Monthly High1.1386
Previous Monthly Low1.1222
Daily Fibonacci 38.2%1.1408
Daily Fibonacci 61.8%1.1418
Daily Pivot Point S11.1388
Daily Pivot Point S21.1368
Daily Pivot Point S31.1345
Daily Pivot Point R11.143
Daily Pivot Point R21.1454
Daily Pivot Point R31.1473

Author

Anil Panchal

Anil Panchal

FXStreet

Anil Panchal has nearly 15 years of experience in tracking financial markets. With a keen interest in macroeconomics, Anil aptly tracks global news/updates and stays well-informed about the global financial moves and their implications.

More from Anil Panchal
Share:

Editor's Picks

AUD/USD falls to near 0.7100 after slipping below 50-day EMA

AUD/USD depreciates after registering minor gains in the previous day, trading around 0.7120 during the Asian hours. The technical analysis of the daily chart shows the pair consolidating sideways within a rectangle pattern, as neither bulls nor bears gain control. The AUD/USD pair is holding a slight bearish tone however as it sits beneath both the nine-day and 50-day EMAs.

160.00: USD/JPY back near intervention territory after upbeat US jobs report

US Nonfarm Payrolls beat expectations by a wide margin in May, with 172K jobs added. The US Dollar rebounds after the release, helping USD/JPY recover from its intraday lows. Warnings from Japanese authorities continue to limit upside potential near the 160.00 threshold.

Gold targets $4,300 amid stronger Dollar

Gold faces increasing selling interest and navigates the area of three-month lows near the $4,300 mark per troy ounce on Friday. The precious metal’s decline comes as traders assess the stronger-than-expected NFP, while the bid bias in the Greenback and higher US Treasury yields also collaborate with the retracement.

Cardano hits five-year low even as Hoskinson clarifies "break" isn't an exit

Cardano (ADA) price is down 10% at press time on Friday, extending losses over 30% so far this week amid Charles Hoskinson's clarification that "break" isn't an exit.

Week ahead – Fed countdown begins amid US inflation data and geopolitical risks

Fed Chair Warsh’s first meeting approaches as key US inflation data could reshape expectations. Oil prices remain elevated as US-Iran talks continue; tariffs also return to the spotlight. ECB is expected to hike; will it be a one-off move or is July live?

The US economy defies the rules: 100 days into the Oil shock and the recession signal is still missing

More than three months after the start of the Iran war and the resulting disruption to global energy markets, the US economy continues to display remarkable resilience. The conflict has triggered a sharp rise in Oil prices, reignited inflationary pressures and fueled widespread concerns about a potential economic slowdown.