|

EUR/USD Price Analysis: Approaches 1.0770 support within weekly bullish channel

  • EUR/USD holds lower ground inside a one-week-old bullish chart pattern.
  • 50-SMA restricts immediate downside but bearish MACD signals, steady RSI hints at further weakness.
  • Monthly horizontal support, 200-SMA add to the downside filters.
  • Bulls need validation from 1.0890 to break the monotony.

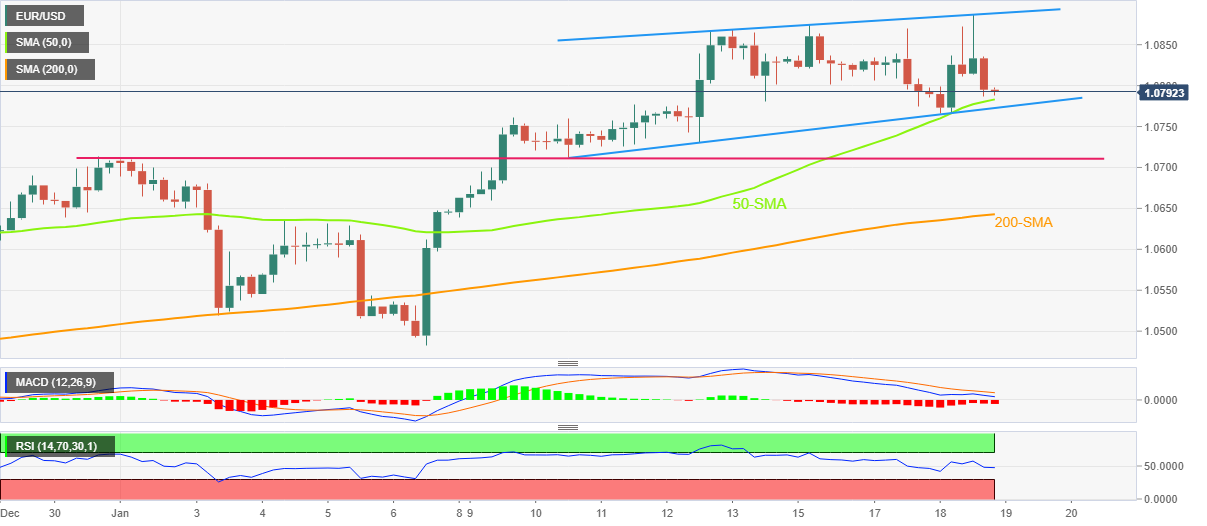
EUR/USD stays pressured around 1.0790 amid the early hours of Thursday’s Asian session, after refreshing the nine-month high but posting a daily negative. In doing so, the major currency pair remains inside a weekly bullish channel, poking the 50-SMA immediate support as of late.

However, the bearish MACD signals and steady RSI (14), not to forget the weekly trading range, keeps the EUR/USD sellers hopeful of breaking the 1.0780 immediate support and approaching the 1.0770 key level comprising the stated channel’s lower line.

It’s worth noting that the quote’s weakness past 1.0770 could quickly drag it to the horizontal area comprising levels marked since 2022’s end, around 1.0710. Following that, the 200-SMA level of 1.0642 could probe the EUR/USD bears.

Alternatively, recovery moves may initially aim for the 1.0830 hurdle before challenging the aforementioned channel’s top line, close to 1.0890 by the press time.

Also acting as an upside filter is the 1.0900 threshold, a break of which could propel the EUR/USD prices towards poking the April 2022 peak near 1.0935. Even so, lows marked during late March 2022, around 1.0945 could challenge the EUR/USD buyers afterward.

EUR/USD: Four-hour chart

Trend: Further downside expected

Additional important levels

Overview
Today last price1.0792
Today Daily Change-0.0002
Today Daily Change %-0.02%
Today daily open1.0794
 
Trends
Daily SMA201.0678
Daily SMA501.0533
Daily SMA1001.0206
Daily SMA2001.031
 
Levels
Previous Daily High1.0869
Previous Daily Low1.0774
Previous Weekly High1.0868
Previous Weekly Low1.0639
Previous Monthly High1.0736
Previous Monthly Low1.0393
Daily Fibonacci 38.2%1.0811
Daily Fibonacci 61.8%1.0833
Daily Pivot Point S11.0756
Daily Pivot Point S21.0718
Daily Pivot Point S31.0661
Daily Pivot Point R11.0851
Daily Pivot Point R21.0908
Daily Pivot Point R31.0946

Author

Anil Panchal

Anil Panchal

FXStreet

Anil Panchal has nearly 15 years of experience in tracking financial markets. With a keen interest in macroeconomics, Anil aptly tracks global news/updates and stays well-informed about the global financial moves and their implications.

More from Anil Panchal
Share:

Markets move fast. We move first.

Orange Juice Newsletter brings you expert driven insights - not headlines. Every day on your inbox.

By subscribing you agree to our Terms and conditions.

Editor's Picks

EUR/USD ticks lower following the release of FOMC Minutes

The US Dollar found some near-term demand following the release of the FOMC meeting minutes, with the EUR/USD pair currently piercing the 1.1750 threshold. The document showed officials are still willing to trim interest rates. Meanwhile, thinned holiday trading keeps major pairs confined to familiar levels.

GBP/USD remains sub- 1.3500, remains in the red

The GBP/USD lost traction early in the American session, maintaining the sour tone and trading around 1.3460 following the release of the FOMC meeting minutes. Trading conditions remain thin ahead of the New Year holiday, limiting the pair's volatility.

Gold stable above $4,350 as the year comes to an end

Gold price got to recover some modest ground on Tuesday, holding on to intraday gains and changing hands at $4,360 a troy ounce in the American afternoon. The bright metal showed no reaction to the release of the FOMC December meeting minutes.

Ethereum: ETH holds above $2,900 despite rising selling activity

Ethereum (ETH) held the $2,900 level despite seeing increased selling pressure over the past week. The Exchange Netflow metric showed deposits outweighed withdrawals by about 400K ETH. The high value suggests rising selling activity amid the holiday season.

Economic outlook 2026-2027 in advanced countries: Solidity test

After a year marked by global economic resilience and ending on a note of optimism, 2026 looks promising and could be a year of solid economic performance. In our baseline scenario, we expect most of the supportive factors at work in 2025 to continue to play a role in 2026.

Crypto market outlook for 2026

Year 2025 was volatile, as crypto often is.  Among positive catalysts were favourable regulatory changes in the U.S., rise of Digital Asset Treasuries (DAT), adoption of AI and tokenization of Real-World-Assets (RWA).