EUR/USD Price Analysis: 1.1100/05 becomes the key upside barrier


  • EUR/USD remains below 21-day SMA, nears 50% Fibonacci retracement.
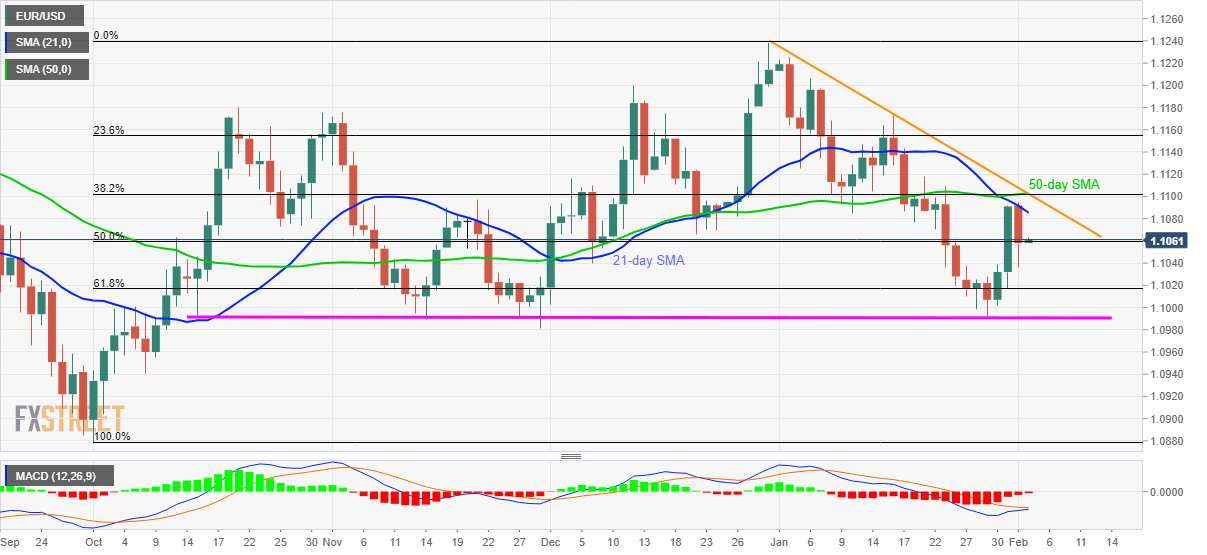
  • A confluence of 50-day SMA, 38.2% Fibonacci retracement and five-week-old descending trend line offers the key resistance.
  • 61.8% Fibonacci retracement, 1.0990/95 can please sellers during further declines.

EUR/USD recovers the previous day’s losses while trading around 1.1060 during early Tuesday. The pair recently took a U-turn from 21-day SMA but failed to stay longer below 50% Fibonacci retracement of its October-December 2019 upside.

With this, prices are likely to again challenge 21-day SMA level of 1.1085. However, 50-day SMA, 38.2% Fibonacci retracement and a short-term falling resistance line could keep challenging the buyers around 1.1100/05.

In a case where prices manage to provide a daily closing beyond 1.1105, January 16 high near 1.1175 and 1.1200/05 can offer intermediate halts during the run-up to December 2019 monthly top close to 1.1240.

Alternatively, 61.8% Fibonacci retracement near 1.1017, followed multi-week-old horizontal support around 1.0995/90, can limit the pair’s further declines.

EUR/USD daily chart

Trend: Pullback expected

Additional important levels

Overview
Today last price 1.1061
Today Daily Change 3 pips
Today Daily Change % 0.03%
Today daily open 1.1058
 
Trends
Daily SMA20 1.1086
Daily SMA50 1.1101
Daily SMA100 1.1072
Daily SMA200 1.1127
 
Levels
Previous Daily High 1.1095
Previous Daily Low 1.1036
Previous Weekly High 1.1092
Previous Weekly Low 1.0992
Previous Monthly High 1.1225
Previous Monthly Low 1.0992
Daily Fibonacci 38.2% 1.1059
Daily Fibonacci 61.8% 1.1072
Daily Pivot Point S1 1.1031
Daily Pivot Point S2 1.1004
Daily Pivot Point S3 1.0972
Daily Pivot Point R1 1.109
Daily Pivot Point R2 1.1122
Daily Pivot Point R3 1.1149


Share: Feed news

Information on these pages contains forward-looking statements that involve risks and uncertainties. Markets and instruments profiled on this page are for informational purposes only and should not in any way come across as a recommendation to buy or sell in these assets. You should do your own thorough research before making any investment decisions. FXStreet does not in any way guarantee that this information is free from mistakes, errors, or material misstatements. It also does not guarantee that this information is of a timely nature. Investing in Open Markets involves a great deal of risk, including the loss of all or a portion of your investment, as well as emotional distress. All risks, losses and costs associated with investing, including total loss of principal, are your responsibility. The views and opinions expressed in this article are those of the authors and do not necessarily reflect the official policy or position of FXStreet nor its advertisers. The author will not be held responsible for information that is found at the end of links posted on this page.

If not otherwise explicitly mentioned in the body of the article, at the time of writing, the author has no position in any stock mentioned in this article and no business relationship with any company mentioned. The author has not received compensation for writing this article, other than from FXStreet.

FXStreet and the author do not provide personalized recommendations. The author makes no representations as to the accuracy, completeness, or suitability of this information. FXStreet and the author will not be liable for any errors, omissions or any losses, injuries or damages arising from this information and its display or use. Errors and omissions excepted.

The author and FXStreet are not registered investment advisors and nothing in this article is intended to be investment advice.

Recommended content


Recommended content

Editors’ Picks

AUD/USD jumps above 0.6500 after hot Australian CPI data

AUD/USD jumps above 0.6500 after hot Australian CPI data

AUD/USD extended gains and recaptured 0.6500 in Asian trading, following the release of hotter-than-expected Australian inflation data. The Australian CPI rose 1% in QoQ in Q1 against 0.8% forecast, providing extra legs to the Australian Dollar upside. 

AUD/USD News

USD/JPY sticks to 34-year high near 154.90 as intervention risks loom

USD/JPY sticks to 34-year high near 154.90 as intervention risks loom

USD/JPY is sitting at a multi-decade high of 154.88 reached on Tuesday. Traders refrain from placing fresh bets on the pair as Japan's FX intervention risks loom. Broad US Dollar weakness also caps the upside in the major. US Durable Goods data are next on tap. 

USD/JPY News

Gold price cautious despite weaker US Dollar and falling US yields

Gold price cautious despite weaker US Dollar and falling US yields

Gold retreats modestly after failing to sustain gains despite fall in US Treasury yields, weaker US Dollar. XAU/USD struggles to capitalize following release of weaker-than-expected S&P Global PMIs, fueling speculation about potential Fed rate cuts.

Gold News

Crypto community reacts as BRICS considers launching stablecoin for international trade settlement

Crypto community reacts as BRICS considers launching stablecoin for international trade settlement

BRICS is intensifying efforts to reduce its reliance on the US dollar after plans for its stablecoin effort surfaced online on Tuesday. Most people expect the stablecoin to be backed by gold, considering BRICS nations have been accumulating large holdings of the commodity.

Read more

US versus the Eurozone: Inflation divergence causes monetary desynchronization

US versus the Eurozone: Inflation divergence causes monetary desynchronization

Historically there is a very close correlation between changes in US Treasury yields and German Bund yields. This is relevant at the current juncture, considering that the recent hawkish twist in the tone of the Fed might continue to push US long-term interest rates higher and put upward pressure on bond yields in the Eurozone.

Read more

Forex MAJORS

Cryptocurrencies

Signatures