|

EUR/USD Price Action: Euro sinks to seven-week lows post ECB

  • EUR/USD is under selling pressure below the 1.1063 resistance.
  • The level to beat for sellers is the 1.1035 support. 
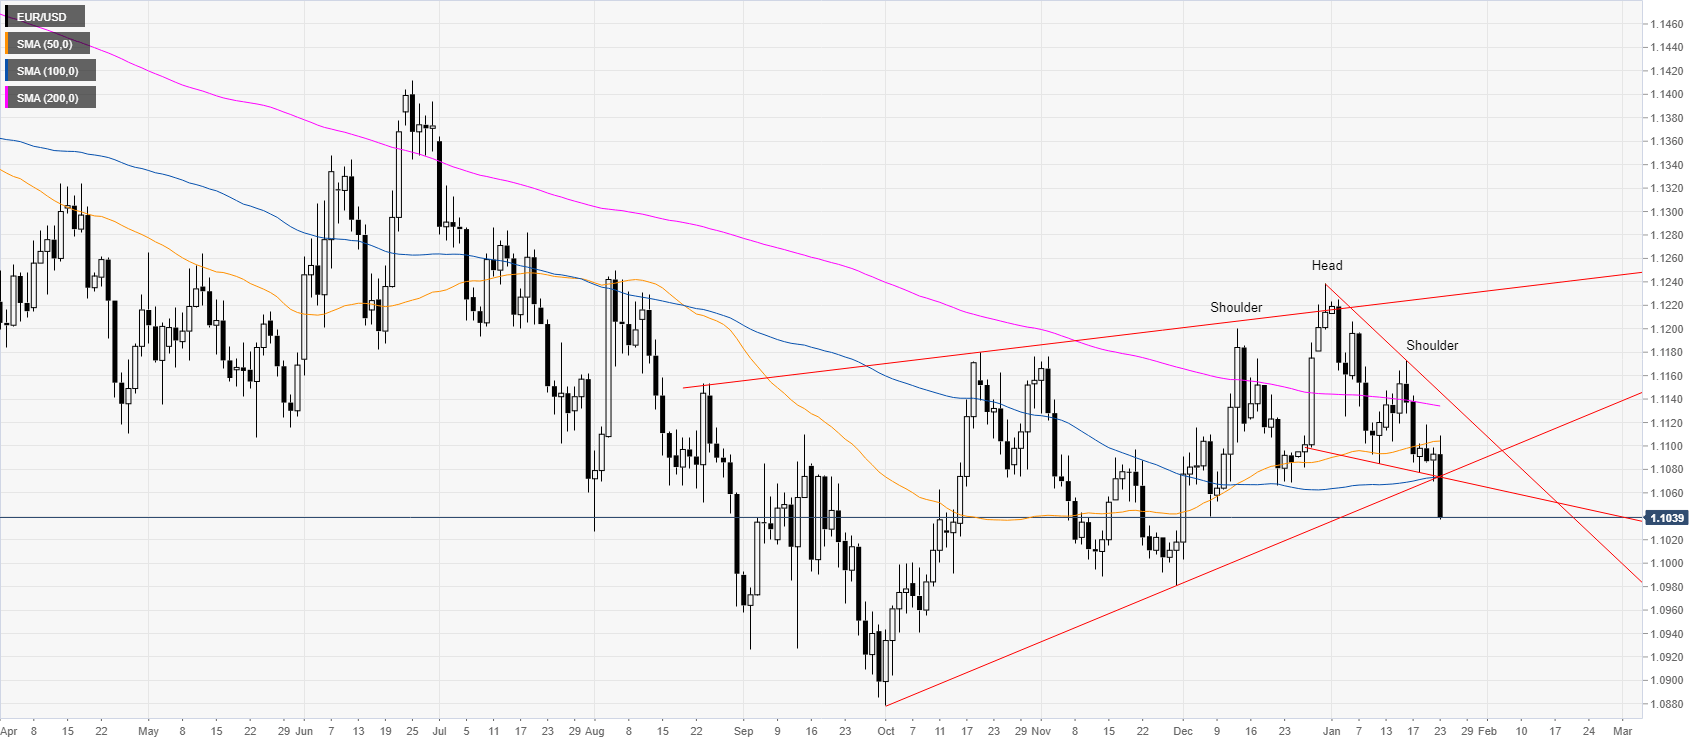
 

EUR/USD daily chart 

 
EUR/USD is trading in a weak downtrend below the main simple moving averages (SMAs). Additionally, the spot is also breaking down from an ascending channel which started in October 2019. The bull flag from December 2019 failed. EUR/USD created a head-and-shoulders formation which is weighing on the euro and so is the ECB press conference.
 

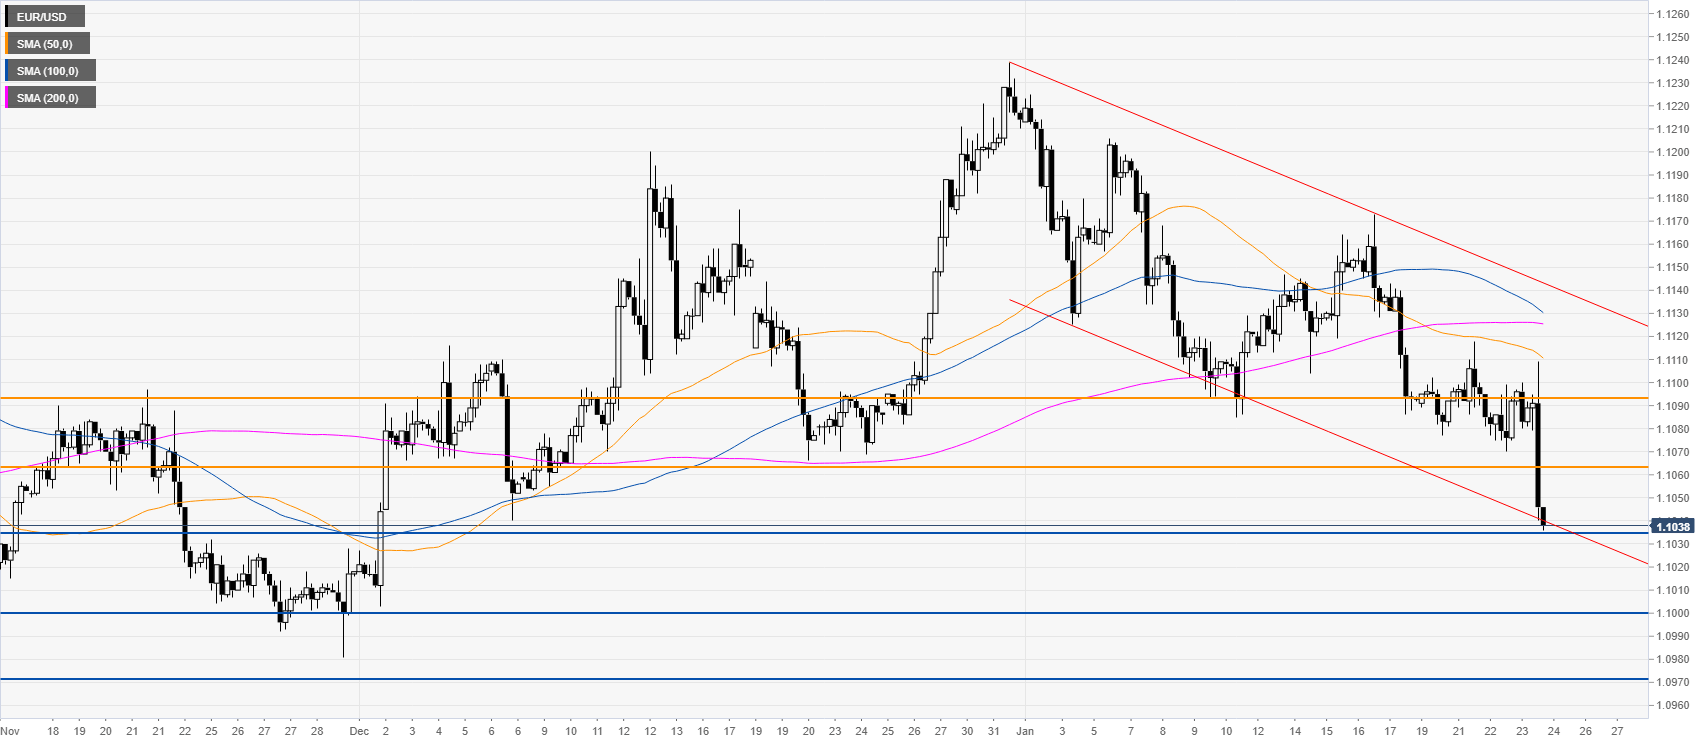
EUR/USD four-hour chart

 
The market is trading in a bear channel below the main SMAs. The spot is challenging the 1.1035 support; if the sellers break below this level, EUR/USD could continue to drift down towards the 1.1000 and 1.0971 levels, according to the Technical Confluences Indicator
  

Additional key levels 

EUR/USD

Overview
Today last price1.1039
Today Daily Change-0.0054
Today Daily Change %-0.49
Today daily open1.1093
 
Trends
Daily SMA201.1143
Daily SMA501.1103
Daily SMA1001.1072
Daily SMA2001.1134
 
Levels
Previous Daily High1.1099
Previous Daily Low1.107
Previous Weekly High1.1173
Previous Weekly Low1.1086
Previous Monthly High1.124
Previous Monthly Low1.1002
Daily Fibonacci 38.2%1.1088
Daily Fibonacci 61.8%1.1081
Daily Pivot Point S11.1076
Daily Pivot Point S21.1058
Daily Pivot Point S31.1047
Daily Pivot Point R11.1105
Daily Pivot Point R21.1116
Daily Pivot Point R31.1134

Author

Flavio Tosti

Flavio Tosti

Independent Analyst


More from Flavio Tosti
Share:

Editor's Picks

EUR/USD flirts with weekly lows near 1.1770

EUR/USD now comes under further selling pressure, breaking below the 1.1800 support to challenge the area of weekly throughs near 1.1770 on Thursday. The pair’s decline comes in response to marked gains in the US Dollar amid steady geopolitical tensions. Ealier in the day, the ECB’s Lagarde delivered cautious remarks, although the currency remained apathetic.

GBP/USD threatens the 200-day SMA near 1.3440

GBP/USD rapidly leaves behind Wednesday’s strong advance, coming under heavy pressure and retesting the 1.3440 zone, where the critical 200-day SMA is located. Cable’s deep pullback follows the strong gains in the Greenback, while investors continue to pencil in a potential BoE rate cut in March.

Gold trims gains, slips back to around $5,170

Gold is now facing some downside pressure, hovering around the $5,170 region on Thursday. The yellow metal surrenders part of its earlier gains on the back of the resurgence of the buying interest in the Greenback. In the meantime, geopolitical tensions in the Middle East continue to limit the downside potential for now.

Stellar: Relief bounce fades as bearish undertone persists

Stellar is trading around $0.16 at the time of writing on Thursday after rebounding more than 8% in the previous day. Derivatives data paints a negative picture as XLM’s short bets hit a monthly high while Open Interest continues to decline.

Changing the game: International implications of recent tariff developments

The Supreme Court ruling on International Emergency Economic Powers Act (IEEPA) tariffs provides limited relief for the rest of the world, with weighted average tariff rates modestly lower.

Bitcoin steadies as traders eye US–Iran talks

Bitcoin (BTC) price is stabilizing around $68,000 at the time of writing on Thursday after a 6.2% relief rally the previous day amid a broader downward trend.