EUR/USD remains bid, US Dollar weakens with US services data on tap
- The euro recovers from its lows and returns above 1.1730, but remains confined within its previous ranges.
- Eurozone Services PMI has been revised to 51.3 in September, from the 51.4 previously estimated.
- US Services PMIs are expected to confirm a moderate expansion of the sector's activity in September.

EUR/USD is posting moderate gains on Friday, trading at the 1.1735 area at the time of writing, after bouncing from 1.1685 lows on Thursday. A mild risk appetite is weighing the safe-haven US Dollar and supporting the Euro, which has largely ignored the downward revision of the Eurozone's services activity data.
Services activity beat expectations in Italy and Spain, while in Germany expanded slightly below forecasts, and in France, the sector accelerated its contraction. All in all, the region's activity expanded at a 51.3 rate, according to the HCOB Purchasing Managers Index. These levels are lower than the 51.4 previously estimated, but still the strongest sector's performance since January, which points to a resilient economic growth at the end of the third quarter.
On Thursday, the US Challenger Job Cuts showed a decline in layoffs in September. Still, hiring plans also fell, showing their lowest level since 2009, which confirms that the labour market is deteriorating.
The US Dollar, however, got a boost from Dallas Federal Reserve (Fed) President Lorie Logan, who cooled hopes of an October interest rate cut. Logan supported the 25 basis points (bps) easing in September, but showed concerns about lowering interest rates too fast and said that she is not eager to cut rates further at the next meeting.
The US federal government shutdown has delayed the release of the US Nonfarm Payrolls report sine die. In its absence, an array of US services activity figures and the speeches from ECB's Isabel Schnabel, and Fed Vice Chair Philip Jefferson will take center stage and might determine the pair's near-term direction later today.
Euro Price Today
The table below shows the percentage change of Euro (EUR) against listed major currencies today. Euro was the strongest against the Japanese Yen.
| USD | EUR | GBP | JPY | CAD | AUD | NZD | CHF | |
|---|---|---|---|---|---|---|---|---|
| USD | -0.18% | -0.21% | 0.10% | -0.03% | -0.17% | -0.25% | -0.08% | |
| EUR | 0.18% | 0.03% | 0.28% | 0.16% | 0.02% | -0.07% | 0.10% | |
| GBP | 0.21% | -0.03% | 0.30% | 0.11% | -0.01% | -0.10% | 0.07% | |
| JPY | -0.10% | -0.28% | -0.30% | -0.15% | -0.30% | -0.38% | -0.23% | |
| CAD | 0.03% | -0.16% | -0.11% | 0.15% | -0.12% | -0.21% | -0.05% | |
| AUD | 0.17% | -0.02% | 0.01% | 0.30% | 0.12% | -0.09% | 0.07% | |
| NZD | 0.25% | 0.07% | 0.10% | 0.38% | 0.21% | 0.09% | 0.17% | |
| CHF | 0.08% | -0.10% | -0.07% | 0.23% | 0.05% | -0.07% | -0.17% |
The heat map shows percentage changes of major currencies against each other. The base currency is picked from the left column, while the quote currency is picked from the top row. For example, if you pick the Euro from the left column and move along the horizontal line to the US Dollar, the percentage change displayed in the box will represent EUR (base)/USD (quote).
Daily digest market movers: Choppy range-bound trading in the absence of US data
- The Euro Dollar is trading without a clear bias, as the US government shutdown has delayed the release of key economic data, namely the US Nonfarm Payrolls scheduled for Friday. In this context, Fed policymakers' opinions are acting as the main driver for US crosses this week.
- Eurozone data released on Thursday revealed that the Unemployment Rate in the countries sharing the Euro (EUR) increased unexpectedly to 6.3% in August, from 6.2% in July. The impact of these figures on the Euro, however, was muted.
- In the US, the Challenger Job Cuts showed a decline to 54,064 in September from 85,979 in August, although hiring plans have shown a total of 204,939 so far this year, which is the lowest since 2009 in the midst of the financial crisis.
- Later today, the US S&P Global Services PMI is expected to confirm that the sector's activity eased to 53.9 in September, from the 54.5 reading seen in August, which suggests that it remains expanding at a healthy pace.
- A few minutes later, the ISM Services PMI is seen showing a moderate slowdown to 51.7 in September, from the August 52.0 reading. The New Orders and employment sub-indices will be analysed carefully for further clues about the impact of trade tariffs.
Technical Analysis: EUR/USD is trading sideways below the 1.1760 resistance area
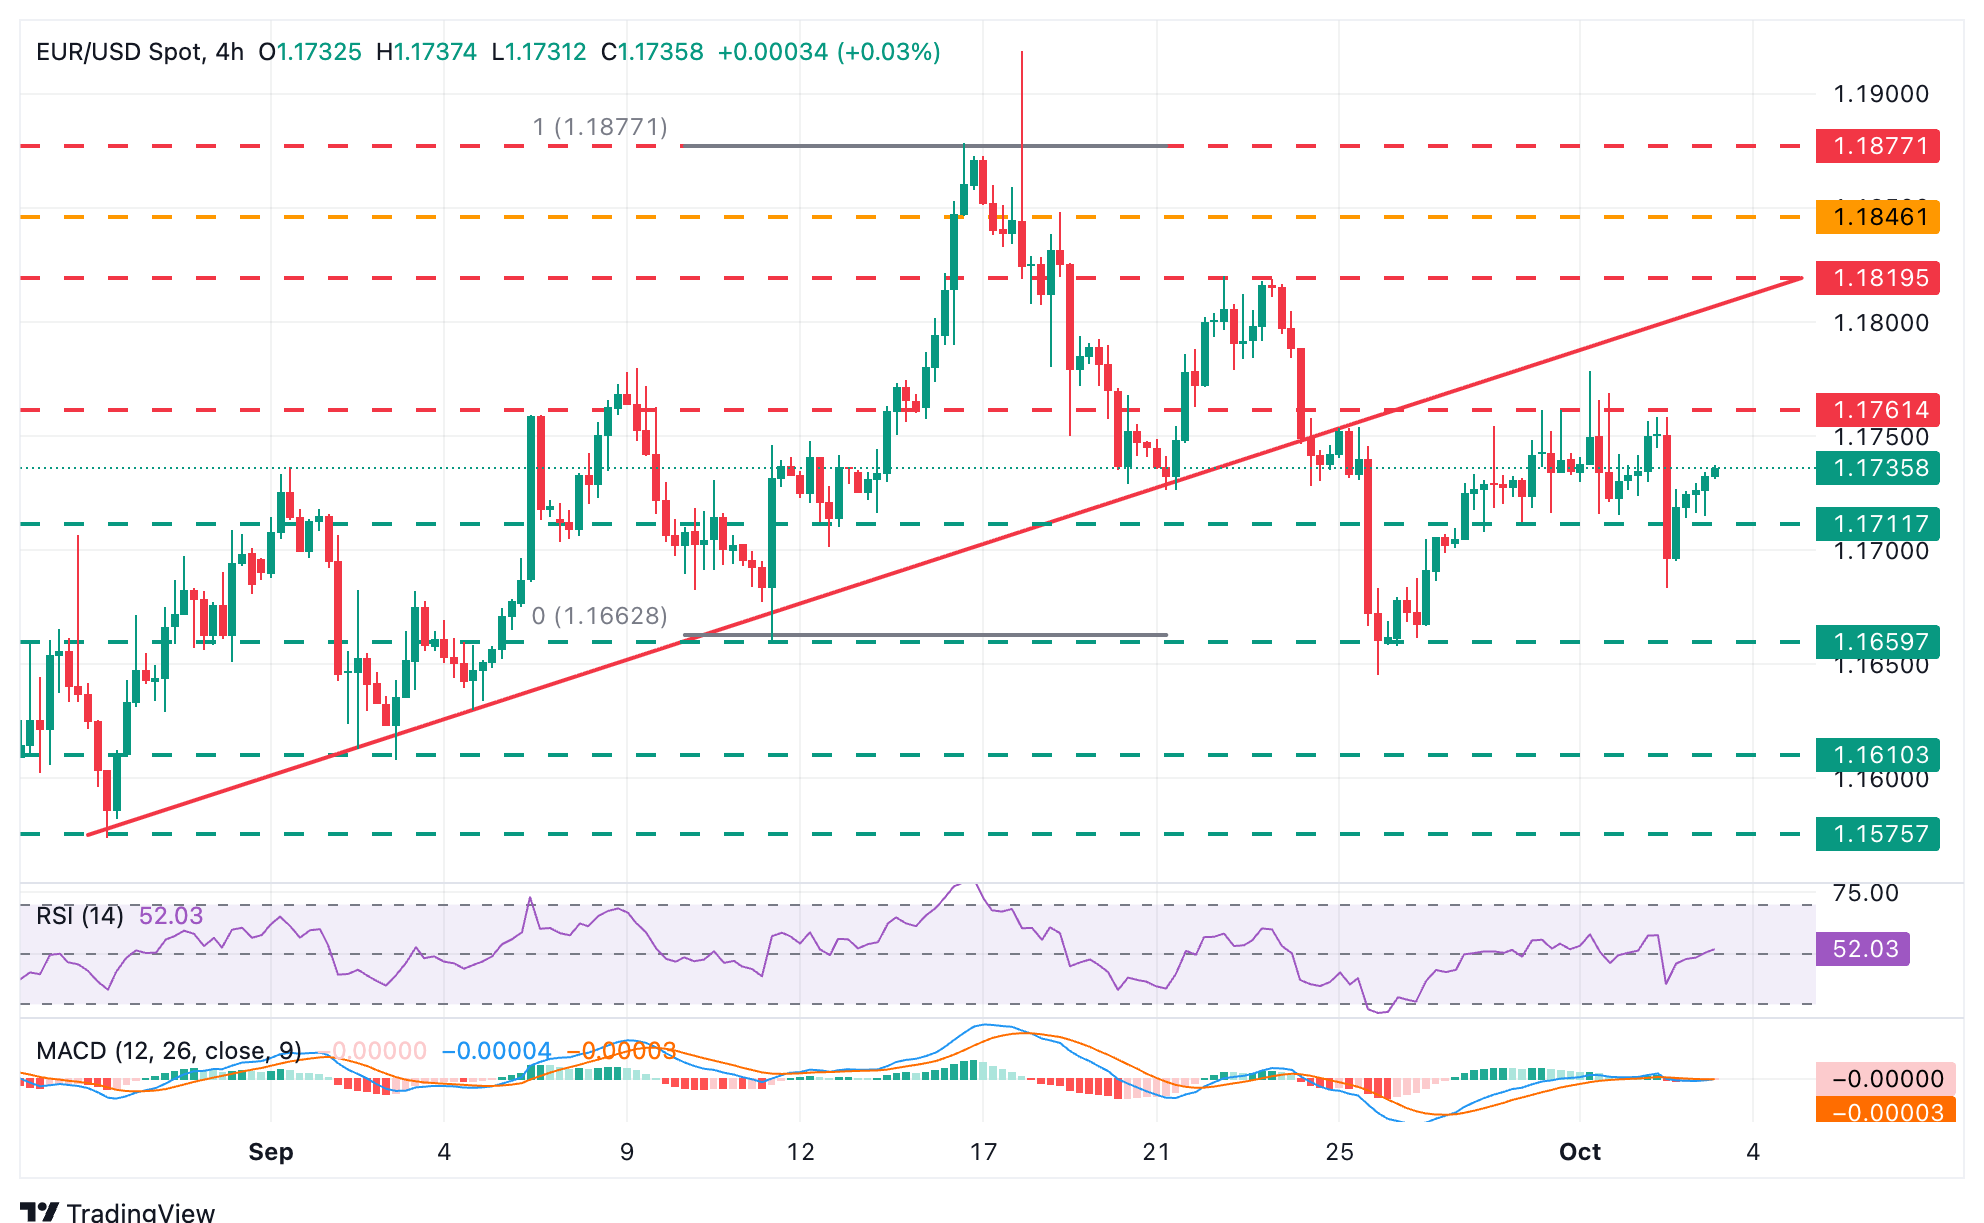
EUR/USD recovery from last week's lows has lost momentum, and the pair is looking for direction below within a horizontal range roughly between 1.1700 and 1.1760. The 4-hour chart Relative Strength Index (RSI) is wavering around the 50 neutral level, and the Moving Average Convergence Divergence (MACD) is flat at the signal line, suggesting a lack of a clear bias.
Immediate resistances are at Thursday's high near 1.1760 and a reverse trendline from late-August lows, now around 1.1800. Failure to return above those levels might give fresh hopes for bears to resume the bearish trend from mid-September highs, above 1.1800.
To the downside, immediate support is at Thursday's low, near 1.1685, ahead of last week's lows at the 1.1645-1.1655 area. Further down, the target is the September 2 and 3 lows, near 1.1610.
(This story was corrected on October 3 at 08.48 GMT to say Eurozone PMI, instead of PNI as it was previously reported.)
Economic Indicator
ISM Services PMI
The Institute for Supply Management (ISM) Services Purchasing Managers Index (PMI), released on a monthly basis, is a leading indicator gauging business activity in the US services sector, which makes up most of the economy. The indicator is obtained from a survey of supply executives across the US based on information they have collected within their respective organizations. Survey responses reflect the change, if any, in the current month compared to the previous month. A reading above 50 indicates that the services economy is generally expanding, a bullish sign for the US Dollar (USD). A reading below 50 signals that services sector activity is generally declining, which is seen as bearish for USD.
Read more.Next release: Fri Oct 03, 2025 14:00
Frequency: Monthly
Consensus: 51.7
Previous: 52
Source: Institute for Supply Management
The Institute for Supply Management’s (ISM) Services Purchasing Managers Index (PMI) reveals the current conditions in the US service sector, which has historically been a large GDP contributor. A print above 50 shows expansion in the service sector’s economic activity. Stronger-than-expected readings usually help the USD gather strength against its rivals. In addition to the headline PMI, the Employment Index and the Prices Paid Index numbers are also watched closely by investors as they provide useful insights regarding the state of the labour market and inflation.
Economic Indicator
S&P Global Services PMI
The S&P Global Services Purchasing Managers Index (PMI), released on a monthly basis, is a leading indicator gauging business activity in the US services sector. As the services sector dominates a large part of the economy, the Services PMI is an important indicator gauging the state of overall economic conditions. The data is derived from surveys of senior executives at private-sector companies from the services sector. Survey responses reflect the change, if any, in the current month compared to the previous month and can anticipate changing trends in official data series such as Gross Domestic Product (GDP), industrial production, employment and inflation. A reading above 50 indicates that the services economy is generally expanding, a bullish sign for the US Dollar (USD). Meanwhile, a reading below 50 signals that activity among service providers is generally declining, which is seen as bearish for USD.
Read more.Next release: Fri Oct 03, 2025 13:45
Frequency: Monthly
Consensus: 53.9
Previous: 53.9
Source: S&P Global
Author

Guillermo Alcala
FXStreet
Graduated in Communication Sciences at the Universidad del Pais Vasco and Universiteit van Amsterdam, Guillermo has been working as financial news editor and copywriter in diverse Forex-related firms, like FXStreet and Kantox.


