EUR/USD is trading below 1.1150, unable to take advantage of the dollar's weakness, ahead of consumer confidence. How is the world's most popular currency pair positioned?
The Technical Confluences Indicator is showing that euro/dollar is capped at 1.1142, which is a dense cluster including the Bollinger Band 15min-Middle, the Simple Moving Average 100-1h, the SMA 200-one-day, the Fibonacci 23.6% one-day, the SMA 10-one-day, the BB 1h-Middle, and many more.
Looking up, another significant hurdle awaits at 1.1195, which is the convergence of the Pivot Point one-week Resistance 1, the PP one-day R2, and the Fibonacci 23.6% one-month.
Looking down, support awaits at 1.1095, which is the confluence of the Fibonacci 61.8% one-month, the SMA 50-one-day, and the PP one-day S2.
Further down, another cushion is at 1.1072, which is the meeting point of the PP one-month S1 and the SMA 100-one-day.
Here is how it looks on the tool:
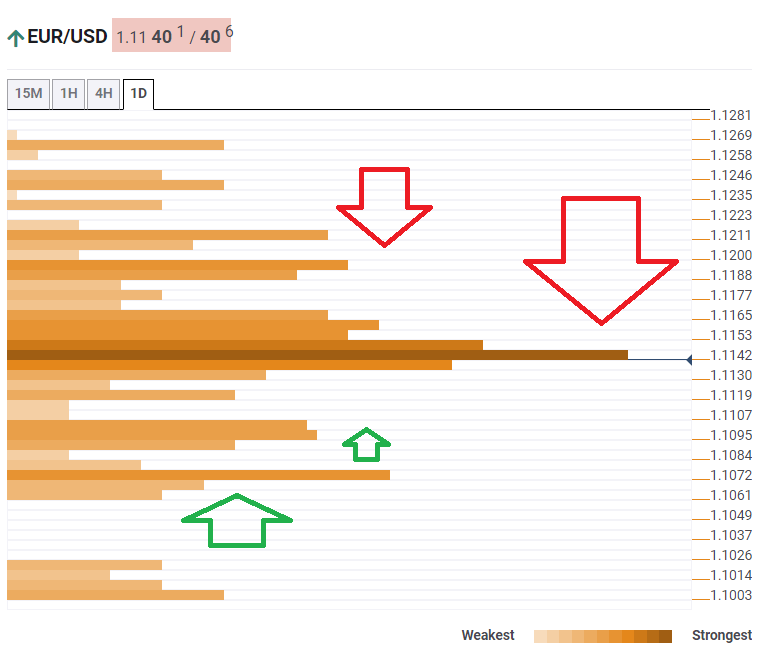
Confluence Detector
The Confluence Detector finds exciting opportunities using Technical Confluences. The TC is a tool to locate and point out those price levels where there is a congestion of indicators, moving averages, Fibonacci levels, Pivot Points, etc. Knowing where these congestion points are located is very useful for the trader, and can be used as a basis for different strategies.
This tool assigns a certain amount of “weight” to each indicator, and this “weight” can influence adjacents price levels. These weightings mean that one price level without any indicator or moving average but under the influence of two “strongly weighted” levels accumulate more resistance than their neighbors. In these cases, the tool signals resistance in apparently empty areas.
Information on these pages contains forward-looking statements that involve risks and uncertainties. Markets and instruments profiled on this page are for informational purposes only and should not in any way come across as a recommendation to buy or sell in these assets. You should do your own thorough research before making any investment decisions. FXStreet does not in any way guarantee that this information is free from mistakes, errors, or material misstatements. It also does not guarantee that this information is of a timely nature. Investing in Open Markets involves a great deal of risk, including the loss of all or a portion of your investment, as well as emotional distress. All risks, losses and costs associated with investing, including total loss of principal, are your responsibility. The views and opinions expressed in this article are those of the authors and do not necessarily reflect the official policy or position of FXStreet nor its advertisers. The author will not be held responsible for information that is found at the end of links posted on this page.
If not otherwise explicitly mentioned in the body of the article, at the time of writing, the author has no position in any stock mentioned in this article and no business relationship with any company mentioned. The author has not received compensation for writing this article, other than from FXStreet.
FXStreet and the author do not provide personalized recommendations. The author makes no representations as to the accuracy, completeness, or suitability of this information. FXStreet and the author will not be liable for any errors, omissions or any losses, injuries or damages arising from this information and its display or use. Errors and omissions excepted.
The author and FXStreet are not registered investment advisors and nothing in this article is intended to be investment advice.
Recommended content
Editors’ Picks
USD/JPY flat-lines below 151.50 after soft Japanese CPI data
USD/JPY stays defensive below 151.50 after the release of a soft Japan's CPI report and mixed Industrial Production and Retail Sales data on Friday. Japanese verbal intervention also weighs on the pair amid the holiday-thinned conditions on Good Friday. US PCE inflation awaited.
AUD/USD buyers lack vigor above 0.6500 amid Good Friday trading lull
AUD/USD is trading listlessly above 0.6500 in the Asian session amid light trading on Good Friday. The Aussie pair shrugs off encouraging comments from China's FX regulator, as price action remains subdued ahead of the US PCE inflation data.
Gold ends Q1 2024 at record highs, what’s next?
Gold is sitting at an all-time high of $2,236, lacking a trading impetus amid holiday-thinned conditions on Good Friday. Most major world markets, including the United States are closed in observance of Holy Friday, leaving volatility around Gold price highly subdued.
Ripple's move above this key level could trigger nearly 50% rally for XRP
Ripple price has overcome a critical resistance level and flipped into a support floor on the weekly time frame. This development happened while XRP tightly consolidated for roughly 250 days. As this coiling up comes undone, investors can expect XRP to kickstart a massive rally.
Will they won’t they cut rates is the question of Q2?
There has been some significant push back from Fed and Bank of England members around the timing of rate cuts, and the Bank of Japan still haven’t physically intervened in the FX market to stem yen weakness although they are threatening to do so.