|

EUR/SEK Price Analysis: Extends its upside below the 11.9000 mark ahead of ECB Lagarde's speech

  • EUR/SEK extends its upside around 11.8875 for the four straight days.
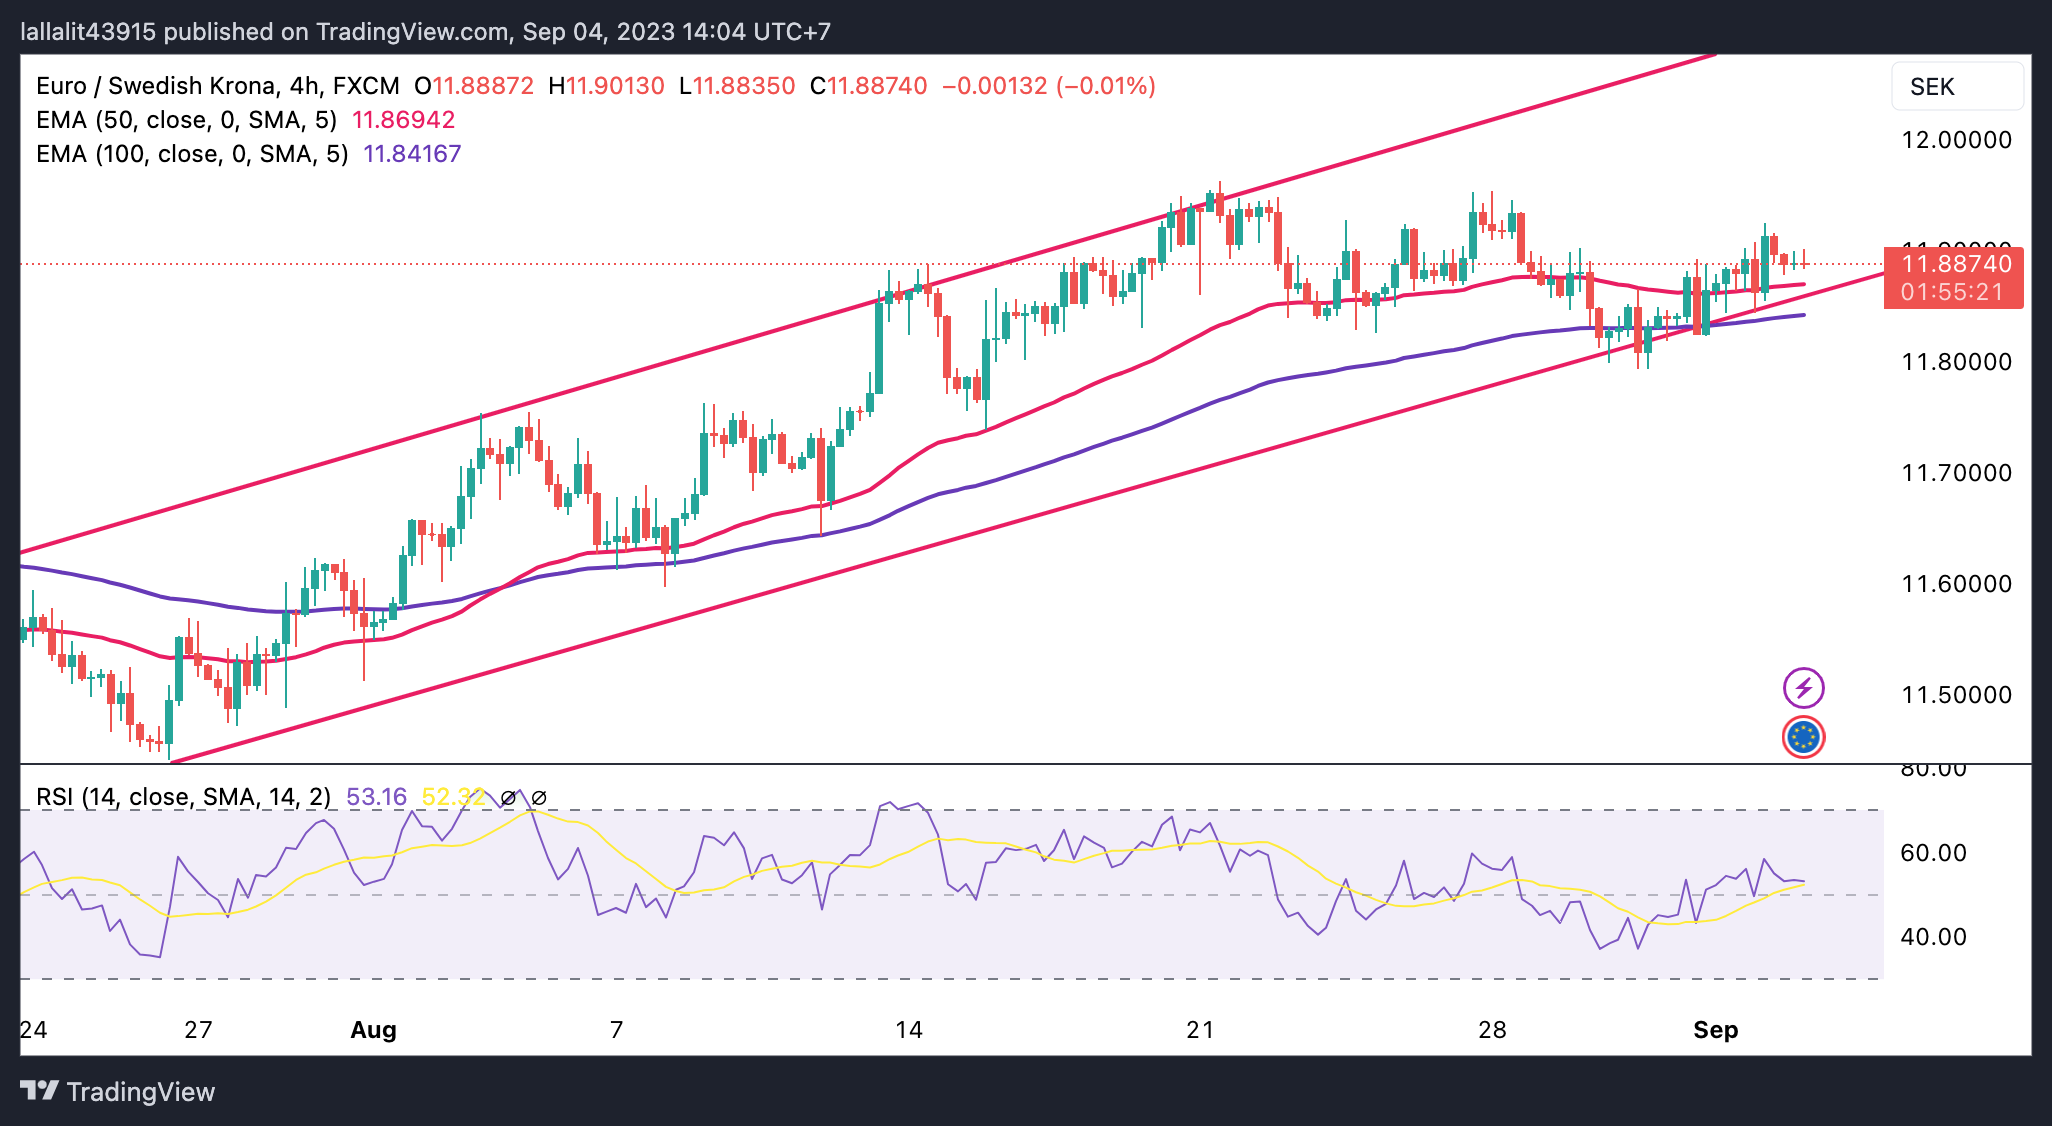
  • The cross trades within the ascending trend-channel on the four-hour chart; the RSI stands in bullish territory above 50.
  • The initial support level is located at 11.8650; a high of September 1 at 11.9240 acts as an immediate resistance level.

The EUR/SEK cross trades in positive territory for the fourth consecutive day. The cross currently trades near 11.8875, losing 0.15% on the day. Market players await the European Central Bank (ECB) President Lagarde's Speech later in the day and will find a clear direction around the cross.

Last week, Riksbank Governor Erik Thedeen stated that the Swedish Krona's (SEK) weakness is unjustified. The policymaker added that the Swedish Krona is very far from a country with a collapsing currency due to several factors.

From the technical perspective, EUR/SEK trades within the ascending trend-channel since the middle of July on the four-hour chart. Additionally, the cross holds above the 50- and 100-hour Exponential Moving Average (EMAs), which means the further upside looks favorable for the time being. Furthermore, the Relative Strength Index (RSI) stands in bullish territory above 50, indicating the path of least resistance seems is to the upside for now.

The initial support level for the cross is located near the lower limit of the ascending trend-channel at 11.8650. The next contention level will emerge at 11.8418 (100-hour EMA). The additional downside filter is located at 11.7375 (a low of August 15).

On the upside, a high of September 1 at 11.9240 acts as an immediate resistance level for the cross. The next upside stop to watch is 11.9500 (a high of July 7). The key barrier for EUR/SEK is located at 11.9625, representing a Year-To-Date (YTD) high. Any meaningful follow-through buying above the latter will see a rally to the next critical area at 12.0000. The mentioned level portrays a psychological round figure and the upper boundary of the ascending trend-channel.
 

EUR/SEK four-hour chart
EUR/SEK

Overview
Today last price11.9001
Today Daily Change-0.0049
Today Daily Change %-0.04
Today daily open11.905
 
Trends
Daily SMA2011.8405
Daily SMA5011.7308
Daily SMA10011.5991
Daily SMA20011.3822
 
Levels
Previous Daily High12.3577
Previous Daily Low11.8468
Previous Weekly High12.3577
Previous Weekly Low11.7936
Previous Monthly High11.9664
Previous Monthly Low11.4122
Daily Fibonacci 38.2%12.1625
Daily Fibonacci 61.8%12.0419
Daily Pivot Point S111.7153
Daily Pivot Point S211.5255
Daily Pivot Point S311.2043
Daily Pivot Point R112.2262
Daily Pivot Point R212.5475
Daily Pivot Point R312.7372

Author

Lallalit Srijandorn

Lallalit Srijandorn is a Parisian at heart. She has lived in France since 2019 and now becomes a digital entrepreneur based in Paris and Bangkok.


More from Lallalit Srijandorn
Share:

Editor's Picks

AUD/USD remains depressed near 0.6950 after RBA minutes

AUD/USD attracts follow-through selling during Tuesday’s Asian session, looking to extend the overnight rejection slide from 0.7000, or a two-week top, following the release of RBA meeting Minutes. The US Dollar retains a bullish undertone near its highest level since April 2025 as energy-driven inflation risks keep December Fed rate hike bets firmly on the table. Adding to this, geopolitical risks further underpin the safe-haven USD.

USD/JPY extends retreat below 158.50 as intervention risks loom

USD/JPY is dropping below 158.50 in the Asian session on Tuesday, snapping a two-day winning streak and pulling back from an over two-week top touched the previous day, despite Japan's soft PPI inflation print. Bulls turn cautious amid speculation that authorities will step in to prop up the Japanese Yen, which, in turn, weighs on the pair.

Gold range play extends amid geopolitics, ahead of US inflation test

Gold extends its struggle below $4,200 early Tuesday as geopolitical risks weigh. US Dollar pinned down by retreating Oil prices and US Treasury bond yields. Technically, the daily bearish RSI continues to caution Gold buyers.

Ripple and Stellar rebound from key technical supports as derivatives turn mildly bullish

Ripple (XRP) and Stellar (XLM) rebound slightly on Tuesday, trading above $1.359 and $0.191, respectively, following a correction the previous day. Both XRP and XLM now test key support levels, with improving derivatives metrics supporting their recovery.

Indian Rupee gains further on RBI’s fresh measures to lower US Dollar’s demand

The Indian Rupee extends the Monday’s advance against the US Dollar on Tuesday, driven by the announcement of fresh Reserve Bank of India’s US Dollar-related measures to shore up the domestic currency. In the opening session, the USD/INR pair tumbles 0.6% to near 95.00, the lowest level seen in over a month.

Has Bitcoin really escaped the macro forces it was built to fight?
Over 17 years ago, Satoshi Nakamoto designed Bitcoin (BTC) on the back of a global financial crisis as an alternative to the global monetary system outside the control of central banks, governments and traditional intermediaries. This raises a key question: has Bitcoin really become independent of the macroeconomic forces it was built to challenge?