|

EUR/JPY technical analysis: Range play near the 113.00 figure
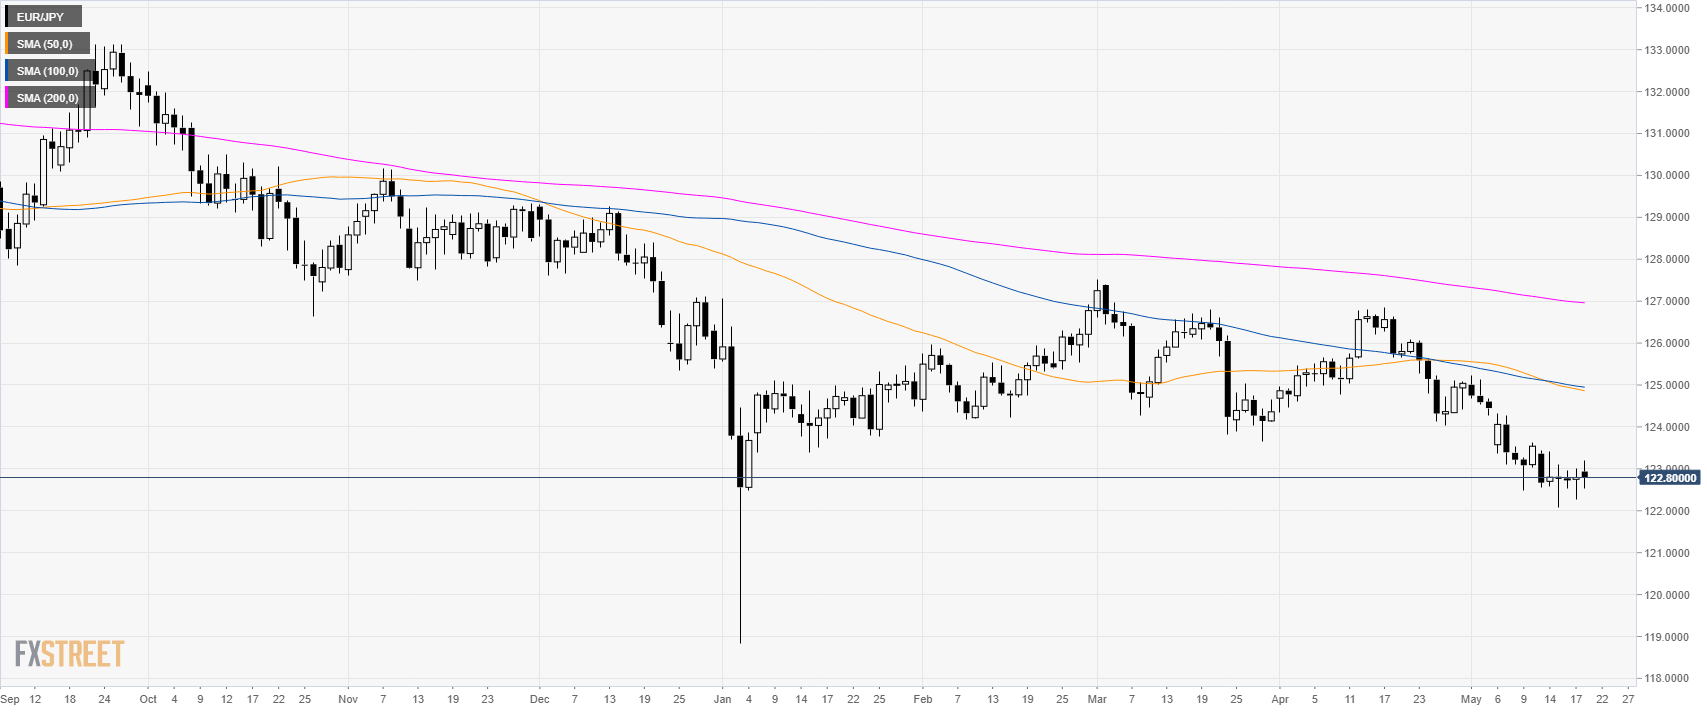
EUR/JPY daily

EUR/JPY has been consolidating for the last 10 days coiling around the 123.00 figure.


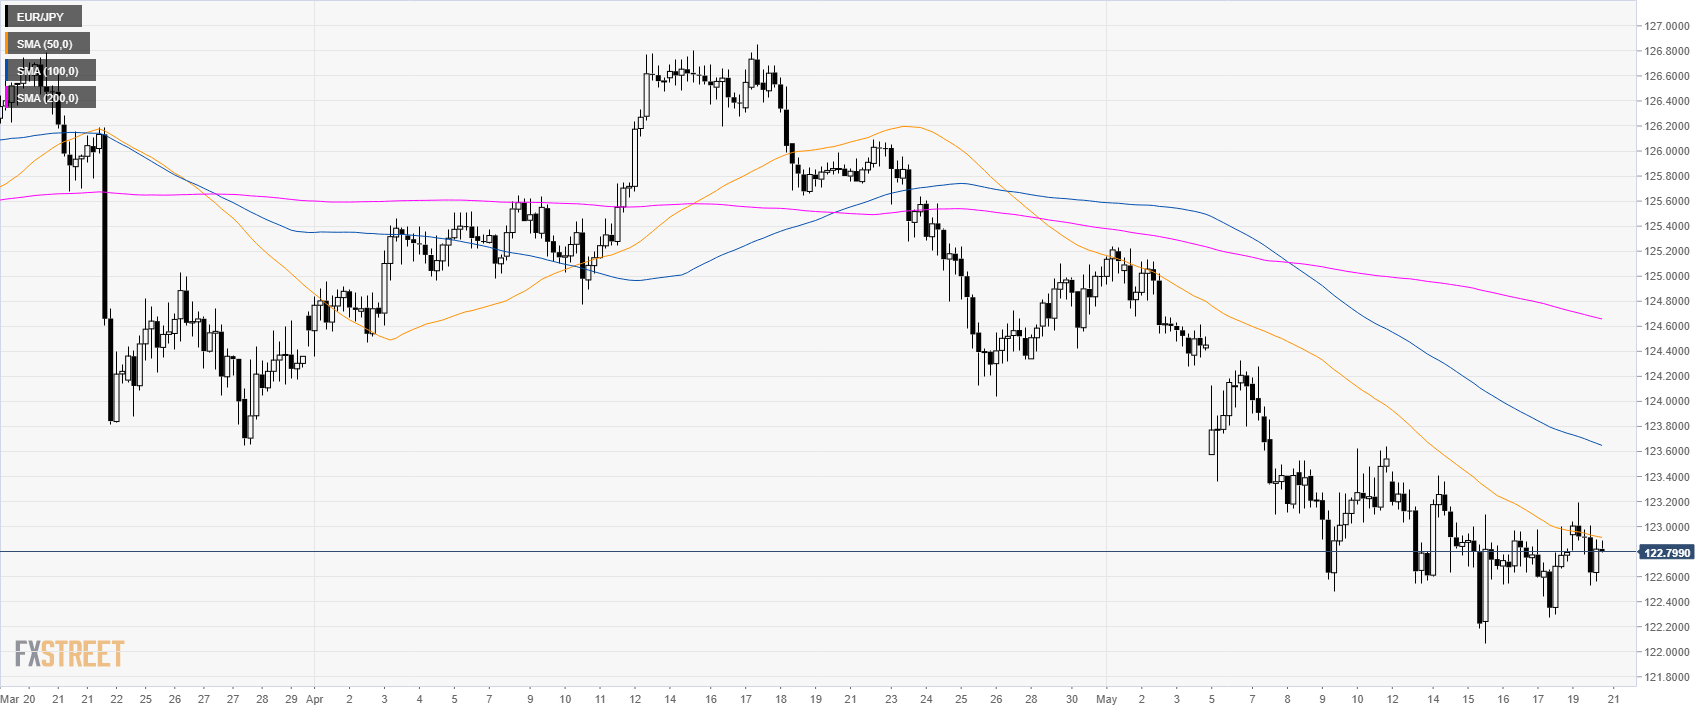
EUR/JPY 4-hour chart


EUR/GBP is trading in a bear leg below its main simple moving averages (SMAs).

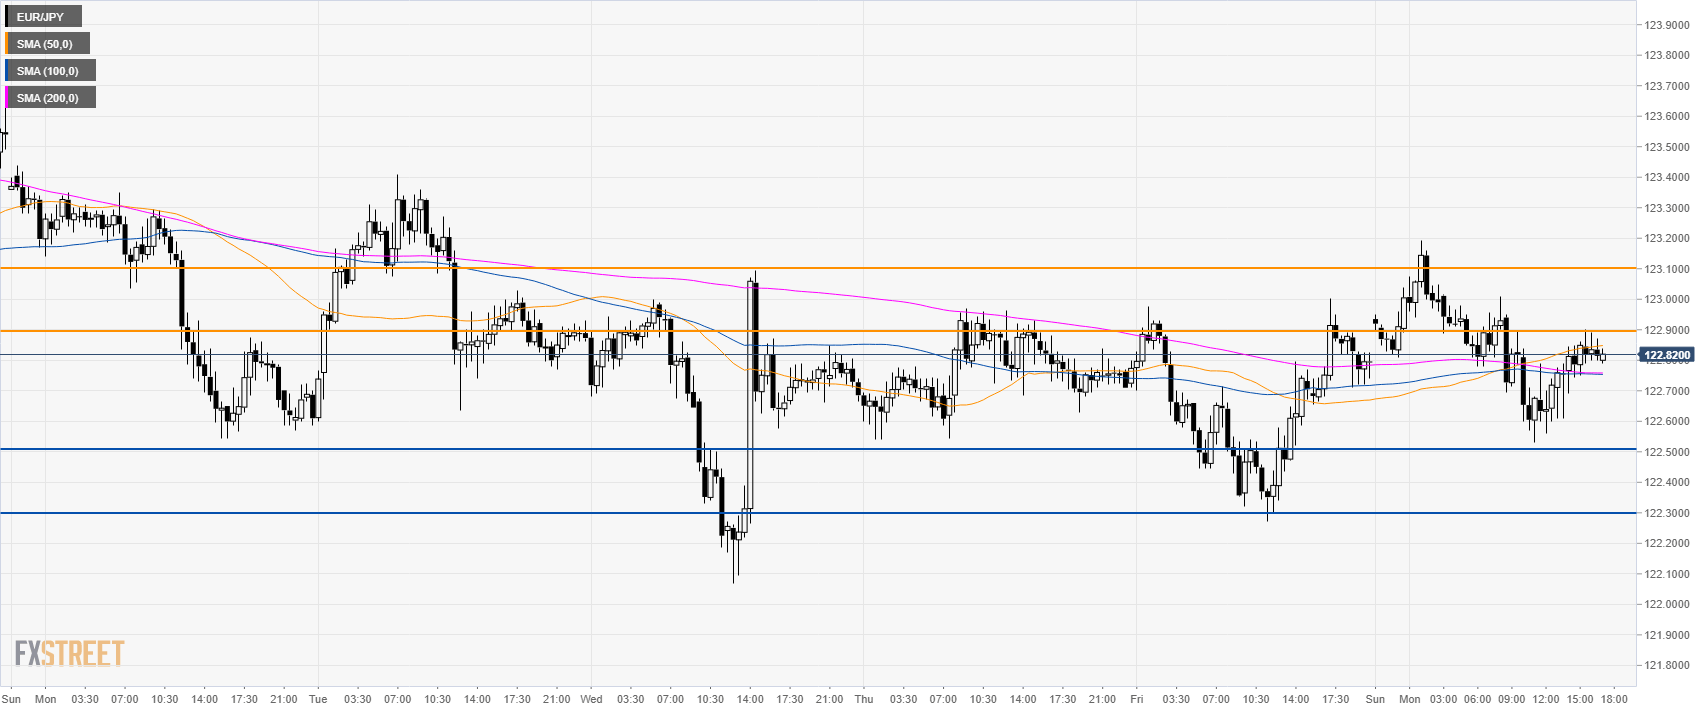
EUR/JPY 30-minute chart

EUR/JPY is ranging below 123.10 and 122.90 resistances.

Bears can try to recapture the 122.50 and 122.30 support in the short term. 


Additional key levels

EUR/JPY

Overview
Today last price122.8
Today Daily Change0.01
Today Daily Change %0.01
Today daily open122.79
 
Trends
Daily SMA20124.01
Daily SMA50124.91
Daily SMA100124.98
Daily SMA200126.98
Levels
Previous Daily High123
Previous Daily Low122.27
Previous Weekly High123.44
Previous Weekly Low122.07
Previous Monthly High126.86
Previous Monthly Low124.04
Daily Fibonacci 38.2%122.72
Daily Fibonacci 61.8%122.55
Daily Pivot Point S1122.37
Daily Pivot Point S2121.96
Daily Pivot Point S3121.64
Daily Pivot Point R1123.11
Daily Pivot Point R2123.42
Daily Pivot Point R3123.84

Author

Flavio Tosti

Flavio Tosti

Independent Analyst


More from Flavio Tosti
Share:

Editor's Picks

EUR/USD treads water above 1.1850 amid thin trading

EUR/USD stays defensive but holds 1.1850 amid quiet markets in the European hours on Monday.  The US Dollar is struggling for direction due to thin liquidity conditions as US markets are closed in observance of Presidents' Day. 

GBP/USD flat lines as traders await key UK and US macro data

GBP/USD kicks off a new week on a subdued note and oscillates in a narrow range near 1.365 in Monday's European trading. The mixed fundamental backdrop warrants some caution for aggressive traders as the market focus now shifts to this week's important releases from the UK and the US.

Gold slides below $5,000 amid USD uptick and positive risk tone; downside seems limited

Gold attracts fresh sellers at the start of a new week and reverses a part of Friday's strong move up of over $150 from sub-$4,900 levels. The commodity slides back below the $5,000 psychological mark during the Asian session, though the downside potential seems limited amid a combination of supporting factors.

Bitcoin, Ethereum and Ripple consolidate within key ranges as selling pressure eases

Bitcoin and Ethereum prices have been trading sideways within key ranges following the massive correction. Meanwhile, XRP recovers slightly, breaking above the key resistance zone. The top three cryptocurrencies hint at a potential short-term recovery, with momentum indicators showing fading bearish signs.

Global inflation watch: Signs of cooling services inflation

Realized inflation landed close to expectations in January, as negative base effects weighed on the annual rates. Remaining sticky inflation is largely explained by services, while tariff-driven goods inflation remains limited even in the US.

Ripple Price Forecast: XRP potential bottom could be in sight

Ripple edges up above the intraday low of $1.35 at the time of writing on Friday amid mixed price actions across the crypto market. The remittance token failed to hold support at $1.40 the previous day, reflecting risk-off sentiment amid a decline in retail and institutional sentiment.