|
EUR/JPY technical analysis: Euro easing from daily highs, trading sub-120.45 level
- EUR/JPY is losing steam nearing the 120.00 handle.
- The level to beat for bears is the 120.15 support.

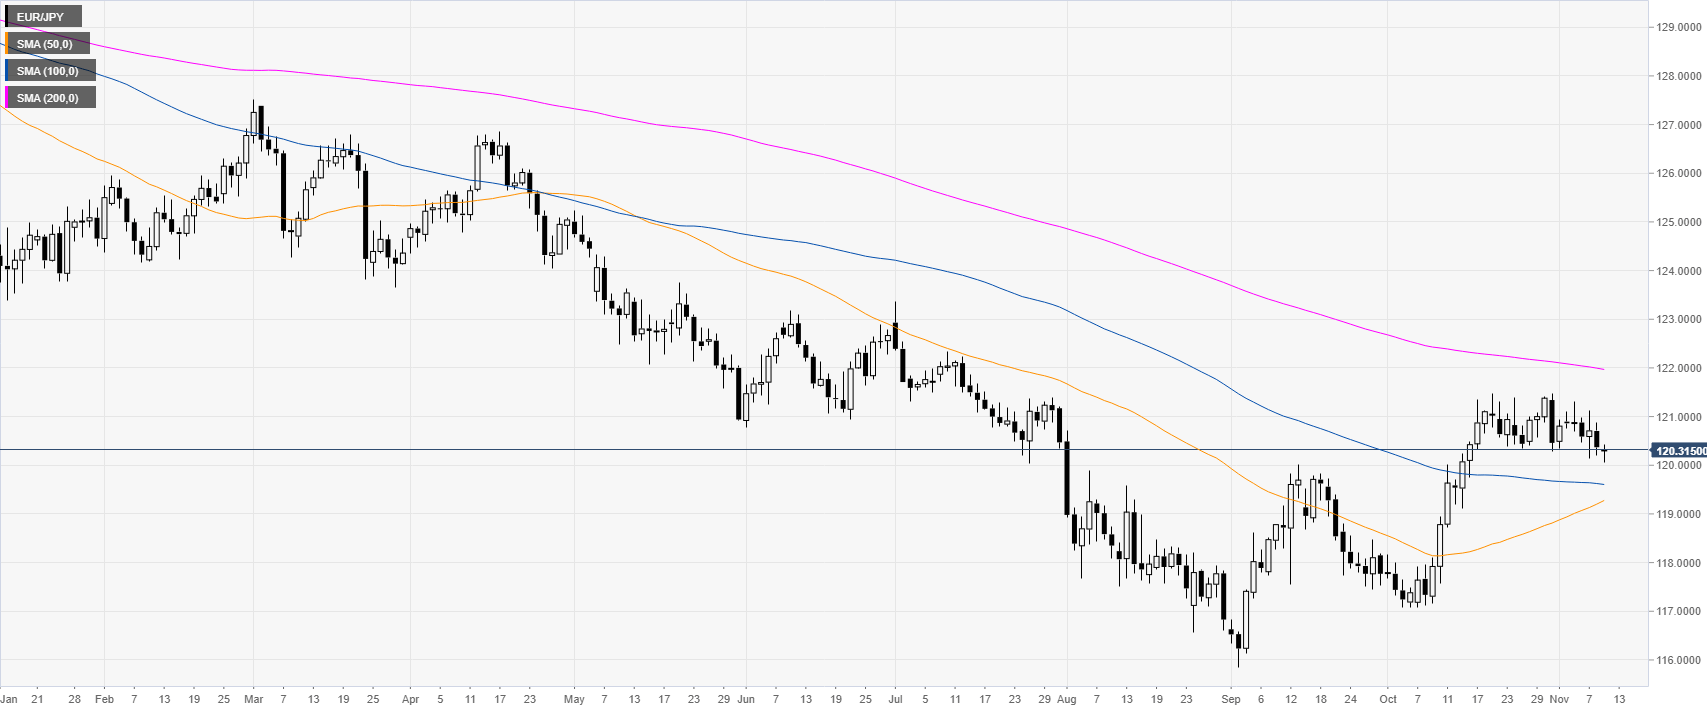
EUR/JPY daily chart
EUR/JPY is trading in a bear trend below its 200-day simple moving average (DMA). However, in October the cross had a bull run to the 121.00 figure. The market has entered a consolidation since then.
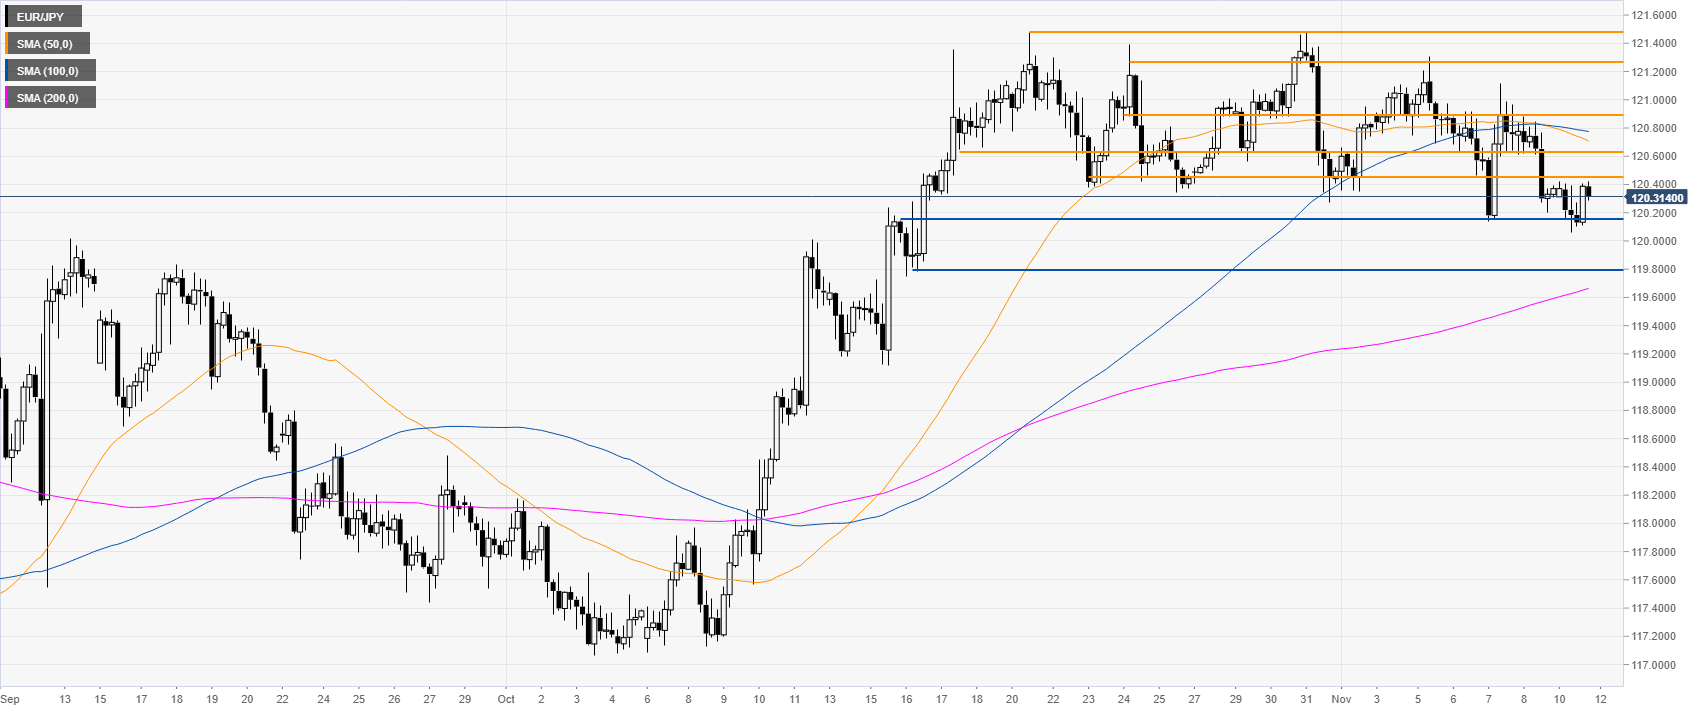
EUR/JPY four-hour chart
On the four-hour chart, the spot is losing some steam below its 50 and 100 SMAs. A break below 120.15 can drive the cross towards 119.80 in the medium term.
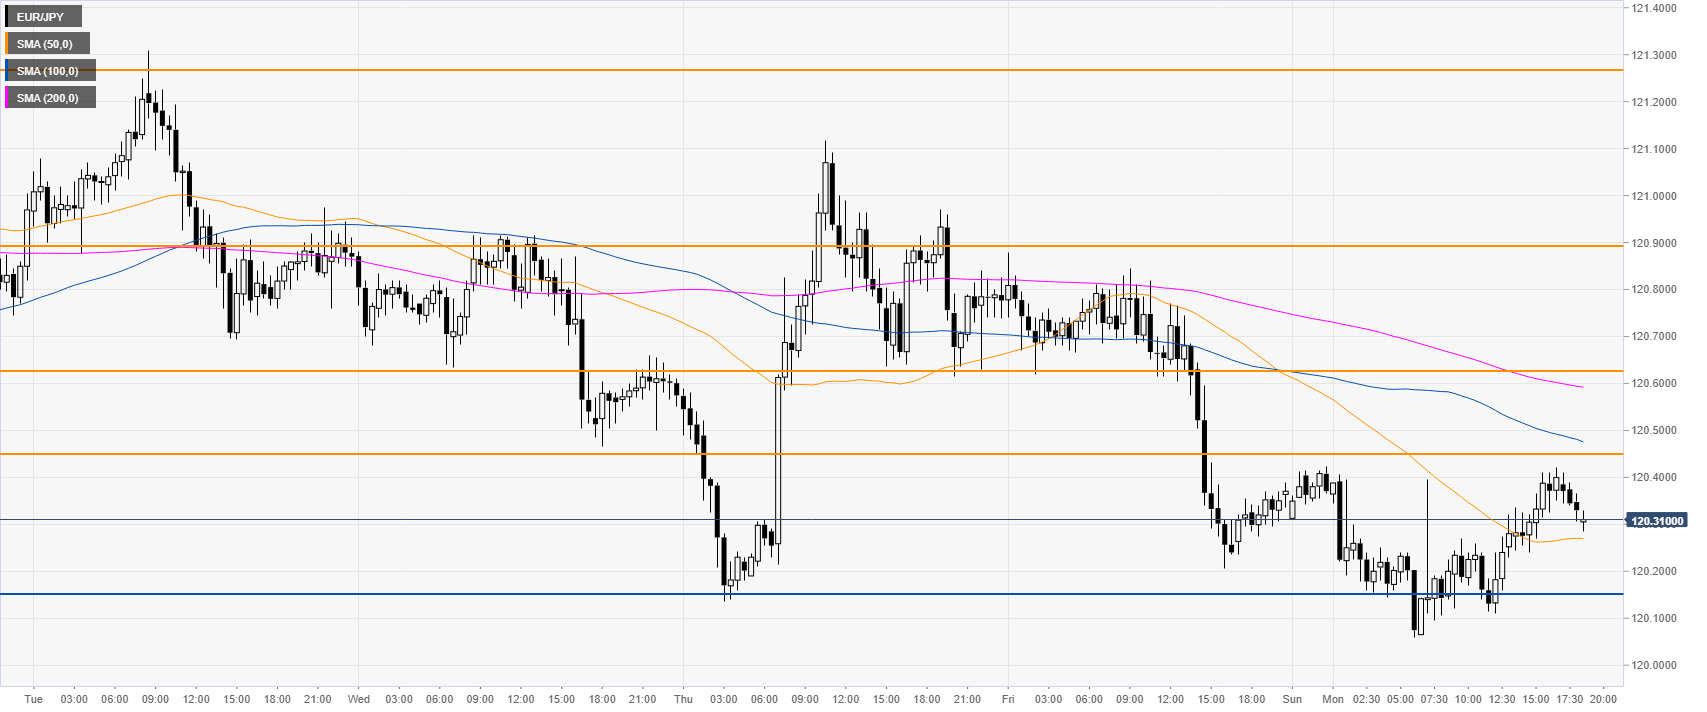
EUR/JPY 30-minute chart
The market is trading below downward sloping 100/200 SMAs, suggesting a bearish bias in the near term. Resistances are seen at the 120.45, 120.65 and 120.90 levels, according to the Technical Confluences Indicator.
Additional key levels
Author

Flavio Tosti
Independent Analyst
More from Flavio Tosti


