|
EUR/JPY technical analysis: Euro easing from daily highs, trading near 120.70 level
- EUR/JPY is erasing parts of the intraday advance.
- The level to beat for bears is the 120.70 support.

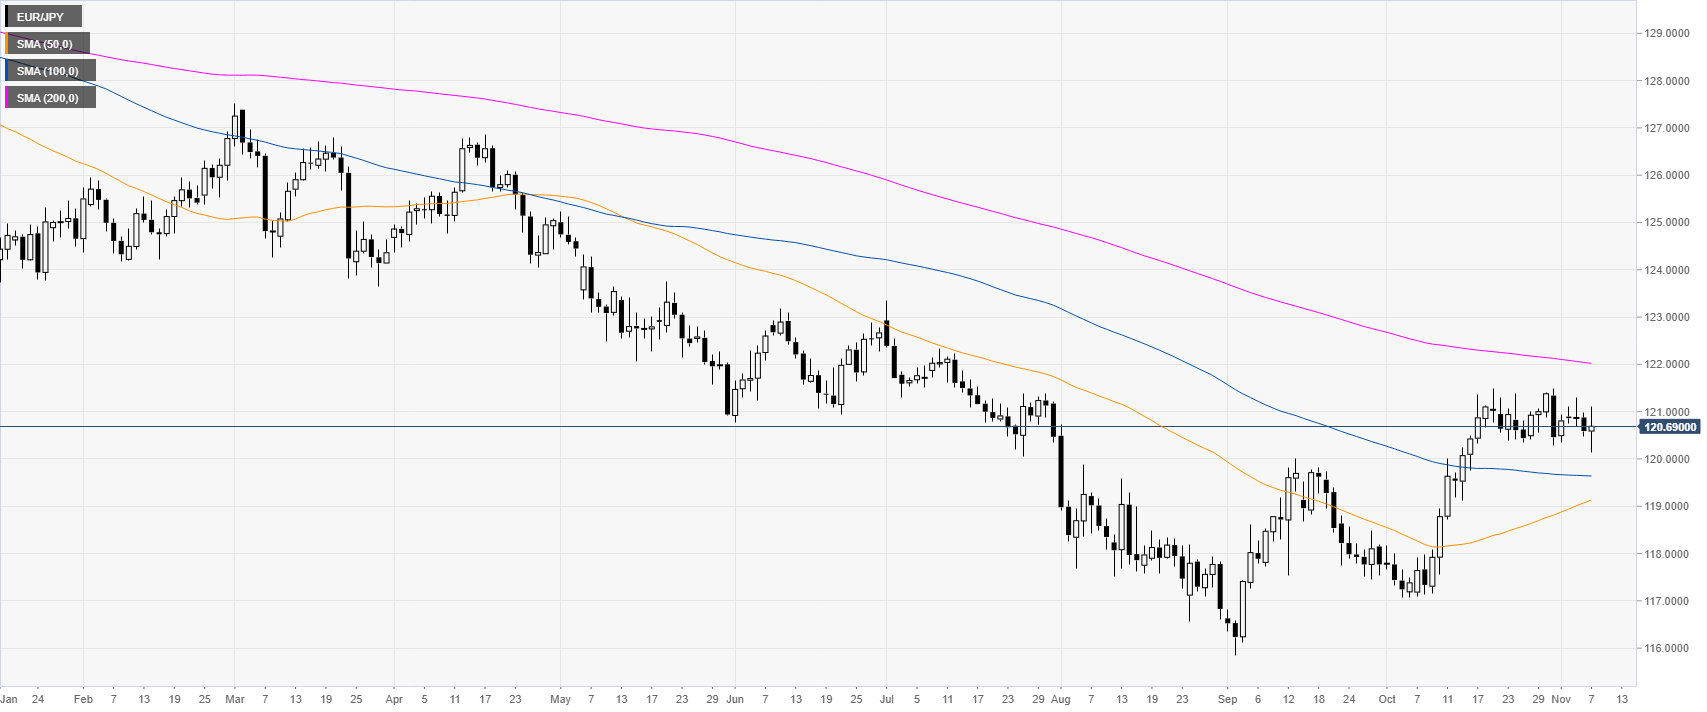
EUR/JPY daily chart
EUR/JPY is trading in a bear trend below its 200-day simple moving average (DMA). However, in October the market had a bull rally to the 121.00 handle where the spot is now consolidating.
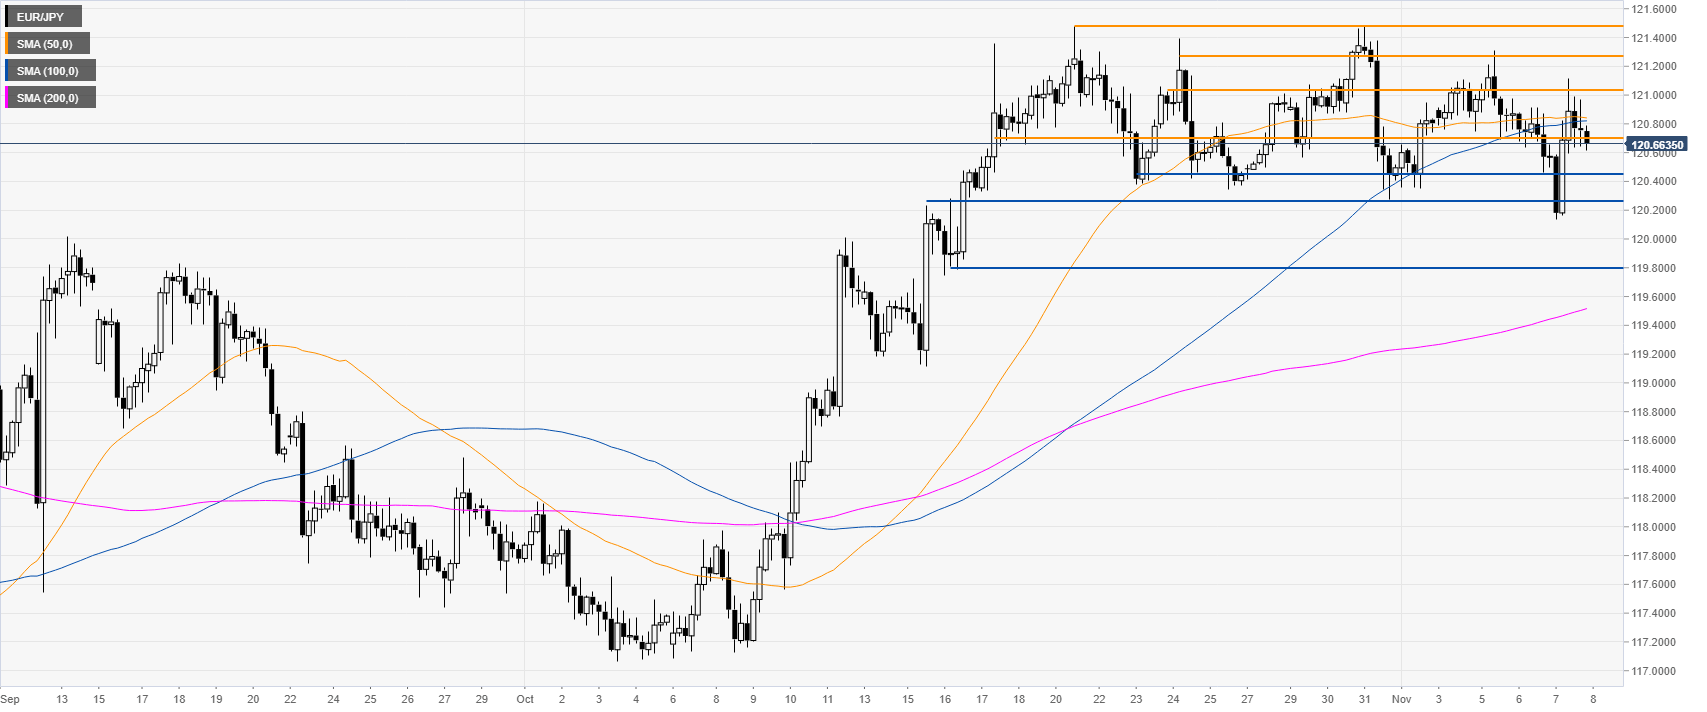
EUR/JPY four-hour chart
On the four-hour chart, the market is trading below its 100 and 200 SMAs, suggesting weakening a bullish bias in the medium term. The spot is trapped in a range and the bulls would need to overcome the 121.28 and 121.53 resistance on a daily closing basis to resume the bull rally.
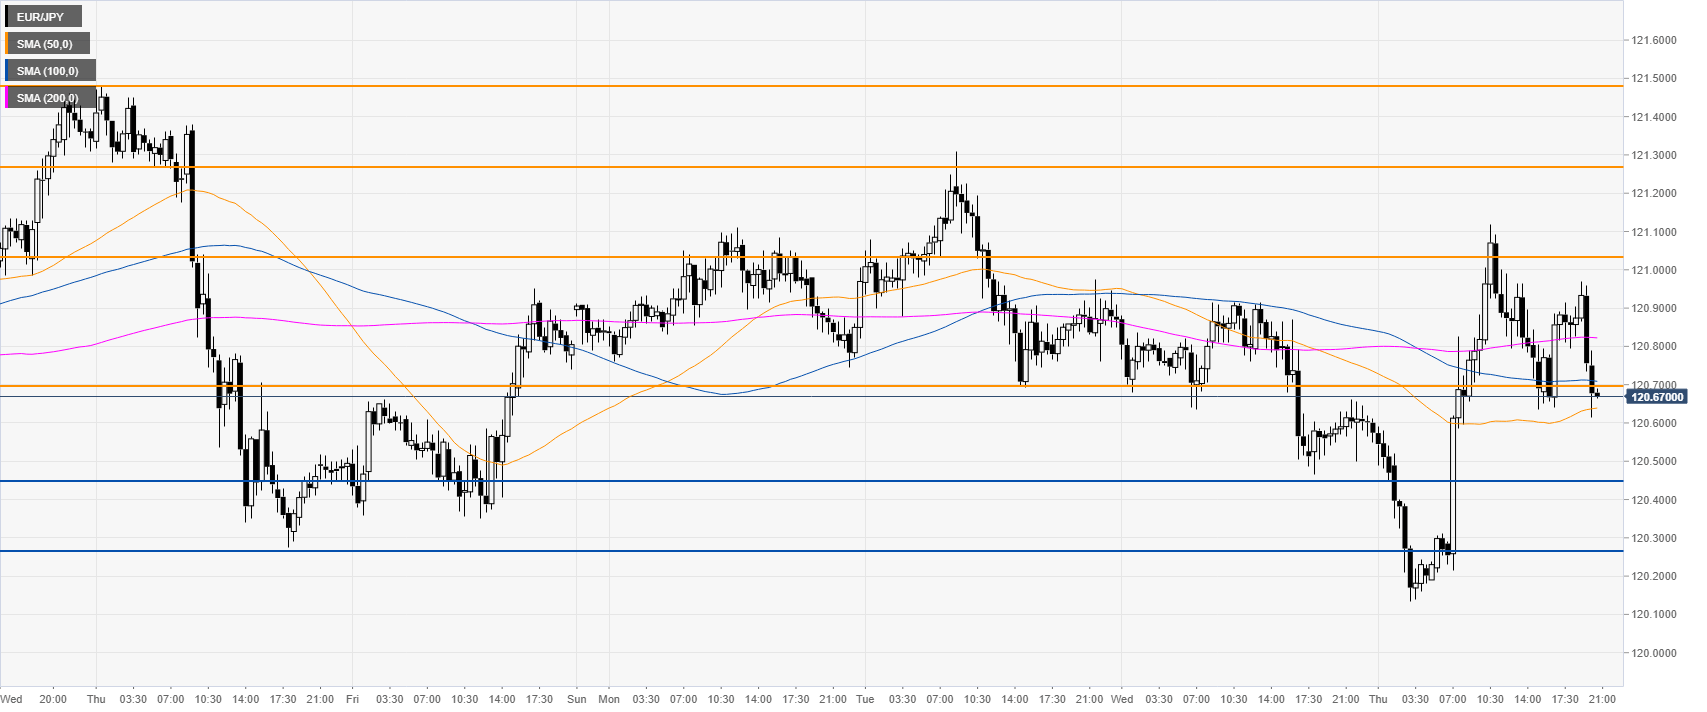
EUR/JPY 30-minute chart
The market is easing from the daily highs now trading near the 120.70 level. The market has room to decline towards the 120.45 and 120.27 support levels in the short term. Further down lie the 119.80 level, according to the Technical Confluences Indicator.
Additional key levels
Author

Flavio Tosti
Independent Analyst
More from Flavio Tosti


