EUR/JPY technical analysis: Buyers lurk around 23.6% Fibo. amid bullish RSI divergence
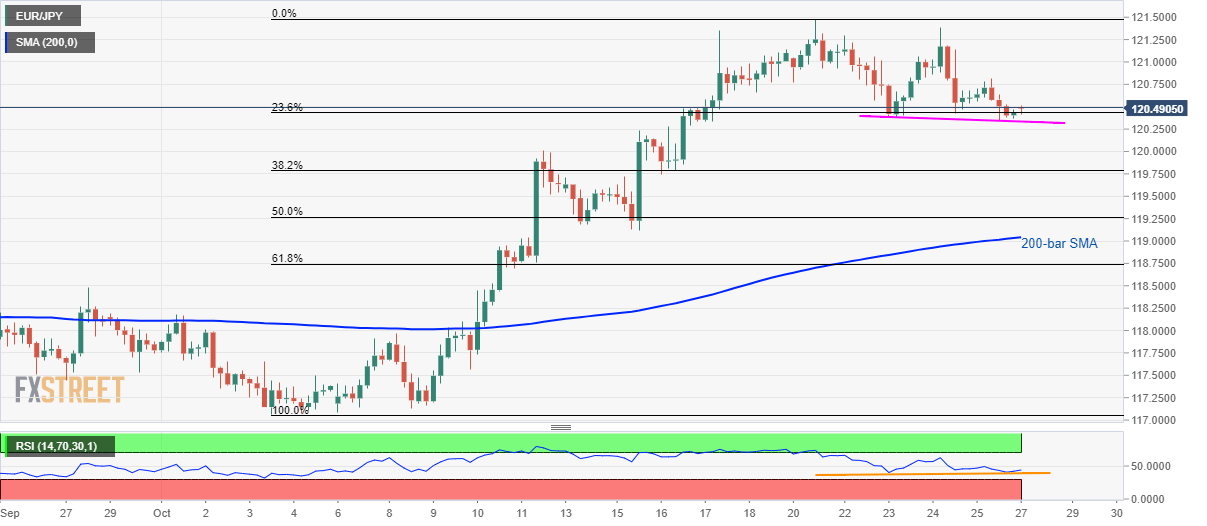
- EUR/JPY refrains from declining below 23.6% Fibonacci retracement of the current month upside.
- Buyers await noticeable recovery to cheer bullish RSI divergence on the H4 chart.

With the bullish RSI divergence on the four-hour chart (H4), EUR/JPY seesaws around 120.50 by the press time of Monday’s Asian session.
The quote repeatedly bounces off 23.6% Fibonacci retracement of the current month’s upside, which in turn portrays a bullish divergence considering the lower low formation of the price and a higher figure of 14-bar Relative Strength Index (RSI).
As a result, buyers await strong recovery, maybe beyond the latest top near 120.80, to target the monthly top close to 121.50.
On the contrary, the pair’s sustained declines below 23.6% Fibonacci retracement level of 120.40 makes it vulnerable to revisit 120.00.
However, 200-bar Simple Moving Average (SMA) near 119.00 could restrict the quote’s further south-run, if not then 61.8% Fibonacci retracement of 118.74 and late-September high surrounding 118.50 becomes the key for sellers to watch.
EUR/JPY 4-hour chart
Trend: bullish
Author

Anil Panchal
FXStreet
Anil Panchal has nearly 15 years of experience in tracking financial markets. With a keen interest in macroeconomics, Anil aptly tracks global news/updates and stays well-informed about the global financial moves and their implications.


