EUR/JPY Price Forecast: Trades around 177.50 after pulling back from fresh highs
- EUR/JPY reached 177.94, an all-time high on Thursday.
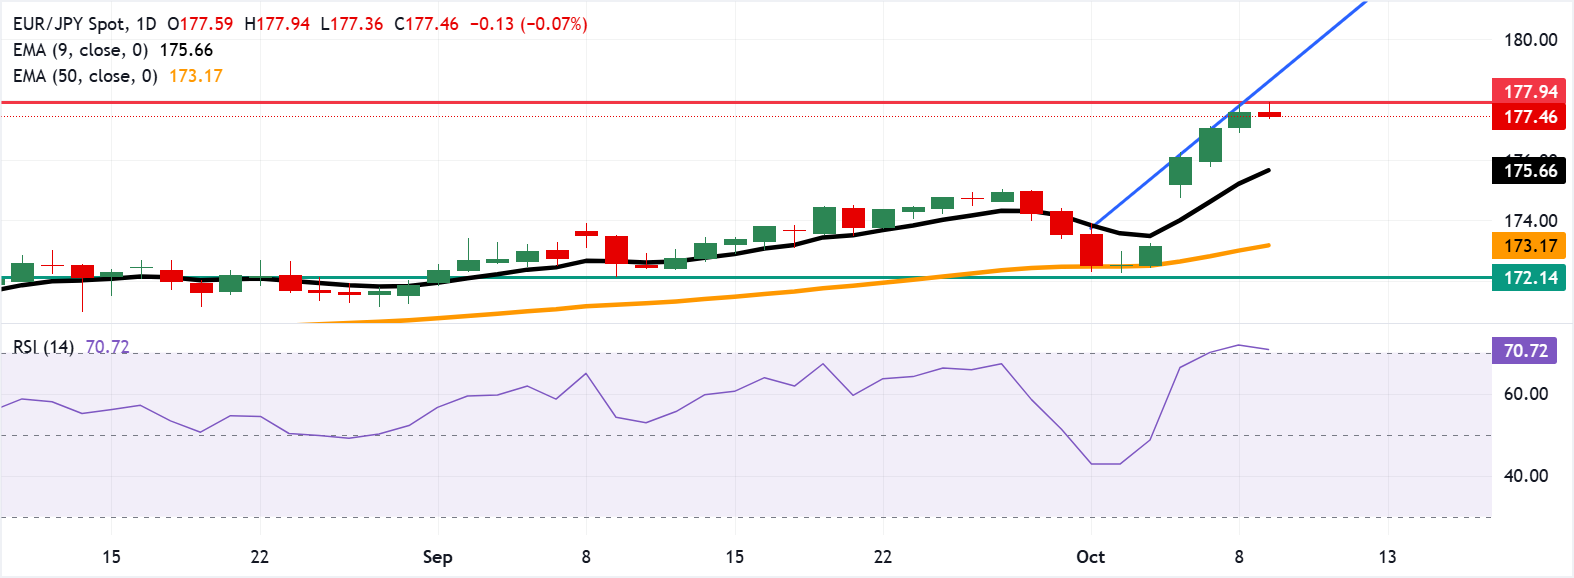
- The 14-day Relative Strength Index remains above 70, suggesting an overbought condition.
- The primary support lies at the nine-day EMA of 175.66.

EUR/JPY holds its position near the fresh all-time high of 177.94, which was recorded during the earlier hours on Thursday, currently trading around 177.50 during the European hours. The technical analysis of the daily chart indicates that short-term price momentum is stronger as the currency cross rises above the nine-day Exponential Moving Average (EMA).
However, the 14-day Relative Strength Index (RSI) maintains its position slightly above the 70 mark, suggesting that the EUR/JPY cross is trading in an overbought territory and a risk for a downward correction at any time soon.
On the upside, the EUR/JPY cross may target the upward trendline around 178.60 after breaking above the new all-time high of 177.94, which was recorded on October 9. Further advances would strengthen the bullish bias and support the currency cross to explore the region around the psychological level of 179.00.
The EUR/JPY cross may find its primary support at the nine-day EMA of 175.66. A break below this level could weaken the short-term price momentum and lead the currency cross to test the 50-day EMA at 173.17, followed by the five-week low of 172.14, which was recorded on September 9.
EUR/JPY: Daily Chart
Euro Price Today
The table below shows the percentage change of Euro (EUR) against listed major currencies today. Euro was the strongest against the New Zealand Dollar.
| USD | EUR | GBP | JPY | CAD | AUD | NZD | CHF | |
|---|---|---|---|---|---|---|---|---|
| USD | 0.14% | 0.28% | 0.08% | 0.00% | -0.08% | 0.29% | 0.16% | |
| EUR | -0.14% | 0.15% | -0.04% | -0.15% | -0.06% | 0.18% | -0.10% | |
| GBP | -0.28% | -0.15% | -0.22% | -0.28% | -0.22% | 0.06% | -0.20% | |
| JPY | -0.08% | 0.04% | 0.22% | -0.15% | -0.06% | 0.17% | 0.02% | |
| CAD | -0.00% | 0.15% | 0.28% | 0.15% | 0.00% | 0.30% | 0.03% | |
| AUD | 0.08% | 0.06% | 0.22% | 0.06% | -0.01% | 0.32% | -0.04% | |
| NZD | -0.29% | -0.18% | -0.06% | -0.17% | -0.30% | -0.32% | -0.27% | |
| CHF | -0.16% | 0.10% | 0.20% | -0.02% | -0.03% | 0.04% | 0.27% |
The heat map shows percentage changes of major currencies against each other. The base currency is picked from the left column, while the quote currency is picked from the top row. For example, if you pick the Euro from the left column and move along the horizontal line to the US Dollar, the percentage change displayed in the box will represent EUR (base)/USD (quote).
Author

Akhtar Faruqui
FXStreet
Akhtar Faruqui is a Forex Analyst based in New Delhi, India. With a keen eye for market trends and a passion for dissecting complex financial dynamics, he is dedicated to delivering accurate and insightful Forex news and analysis.


