EUR/JPY Price Forecast: Tests nine-day EMA support near channel’s lower boundary at 161.50
- The EUR/JPY cross may face initial resistance around the psychological level of 165.00.
- The 14-day Relative Strength Index (RSI) remains above 50, strengthening the bullish outlook.
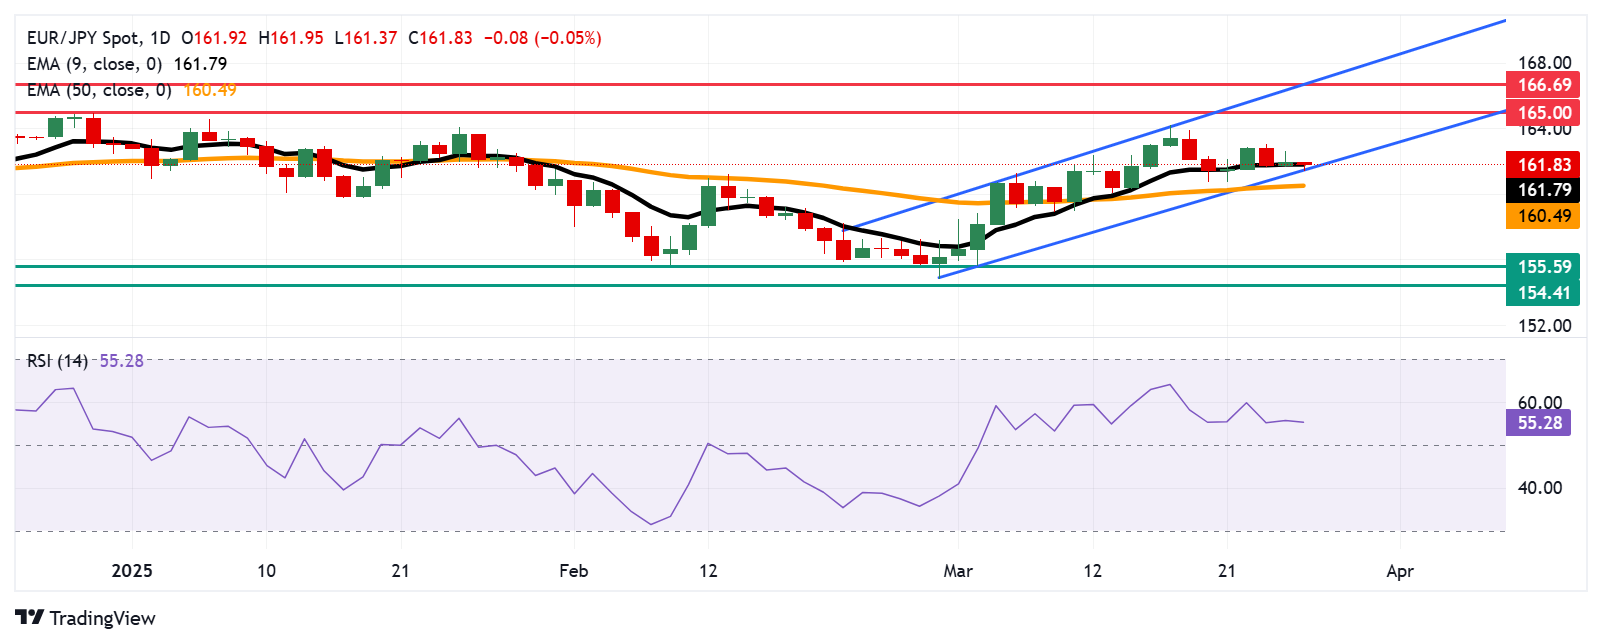
- Immediate support is seen at the nine-day EMA of 161.79, followed by the ascending channel’s lower boundary at 161.50.

EUR/JPY dips slightly after gaining in the previous session, hovering around 161.90 during Thursday’s Asian trading hours. Technical analysis of the daily chart indicates the currency cross is moving within an ascending channel, supporting a bullish outlook.
Additionally, the 14-day Relative Strength Index (RSI) remains above 50, reinforcing the bullish bias. The cross also stays above the nine-day Exponential Moving Average (EMA), signaling strong short-term momentum and the potential for further gains.
On the upside, the EUR/JPY cross could encounter initial resistance near the "pullback resistance" around the psychological level of 165.00. Beyond this, the next key hurdle lies at 166.69—an eight-month high last reached in October 2024—aligning with the upper boundary of the ascending channel.
The EUR/JPY cross may find initial support at the nine-day EMA of 161.79, followed by the ascending channel’s lower boundary at 161.50. A break below this critical support zone could weaken short-term momentum, potentially driving the cross toward the 50-day EMA at 160.49.
Further decline below the 50-day EMA could erode medium-term momentum, intensifying bearish pressure and dragging the cross toward its monthly low of 155.59, recorded on March 4, followed by 154.41, its lowest level since December 2023.
EUR/JPY: Daily Chart
Euro PRICE Today
The table below shows the percentage change of Euro (EUR) against listed major currencies today. Euro was the weakest against the Japanese Yen.
| USD | EUR | GBP | JPY | CAD | AUD | NZD | CHF | |
|---|---|---|---|---|---|---|---|---|
| USD | -0.25% | -0.18% | -0.27% | 0.00% | -0.15% | -0.11% | -0.13% | |
| EUR | 0.25% | 0.04% | -0.06% | 0.23% | 0.06% | 0.12% | 0.09% | |
| GBP | 0.18% | -0.04% | -0.10% | 0.19% | 0.02% | 0.06% | 0.05% | |
| JPY | 0.27% | 0.06% | 0.10% | 0.27% | 0.10% | 0.14% | 0.15% | |
| CAD | -0.01% | -0.23% | -0.19% | -0.27% | -0.15% | -0.11% | -0.13% | |
| AUD | 0.15% | -0.06% | -0.02% | -0.10% | 0.15% | 0.05% | 0.04% | |
| NZD | 0.11% | -0.12% | -0.06% | -0.14% | 0.11% | -0.05% | -0.01% | |
| CHF | 0.13% | -0.09% | -0.05% | -0.15% | 0.13% | -0.04% | 0.01% |
The heat map shows percentage changes of major currencies against each other. The base currency is picked from the left column, while the quote currency is picked from the top row. For example, if you pick the Euro from the left column and move along the horizontal line to the US Dollar, the percentage change displayed in the box will represent EUR (base)/USD (quote).
BRANDED CONTENT
Choosing a broker that aligns with your trading needs can significantly impact performance. Our list of the best regulated brokers highlights the best options for seamless and cost-effective trading.
Author

Akhtar Faruqui
FXStreet
Akhtar Faruqui is a Forex Analyst based in New Delhi, India. With a keen eye for market trends and a passion for dissecting complex financial dynamics, he is dedicated to delivering accurate and insightful Forex news and analysis.