EUR/JPY Price Forecast: Rises sharply as bulls target 161.00
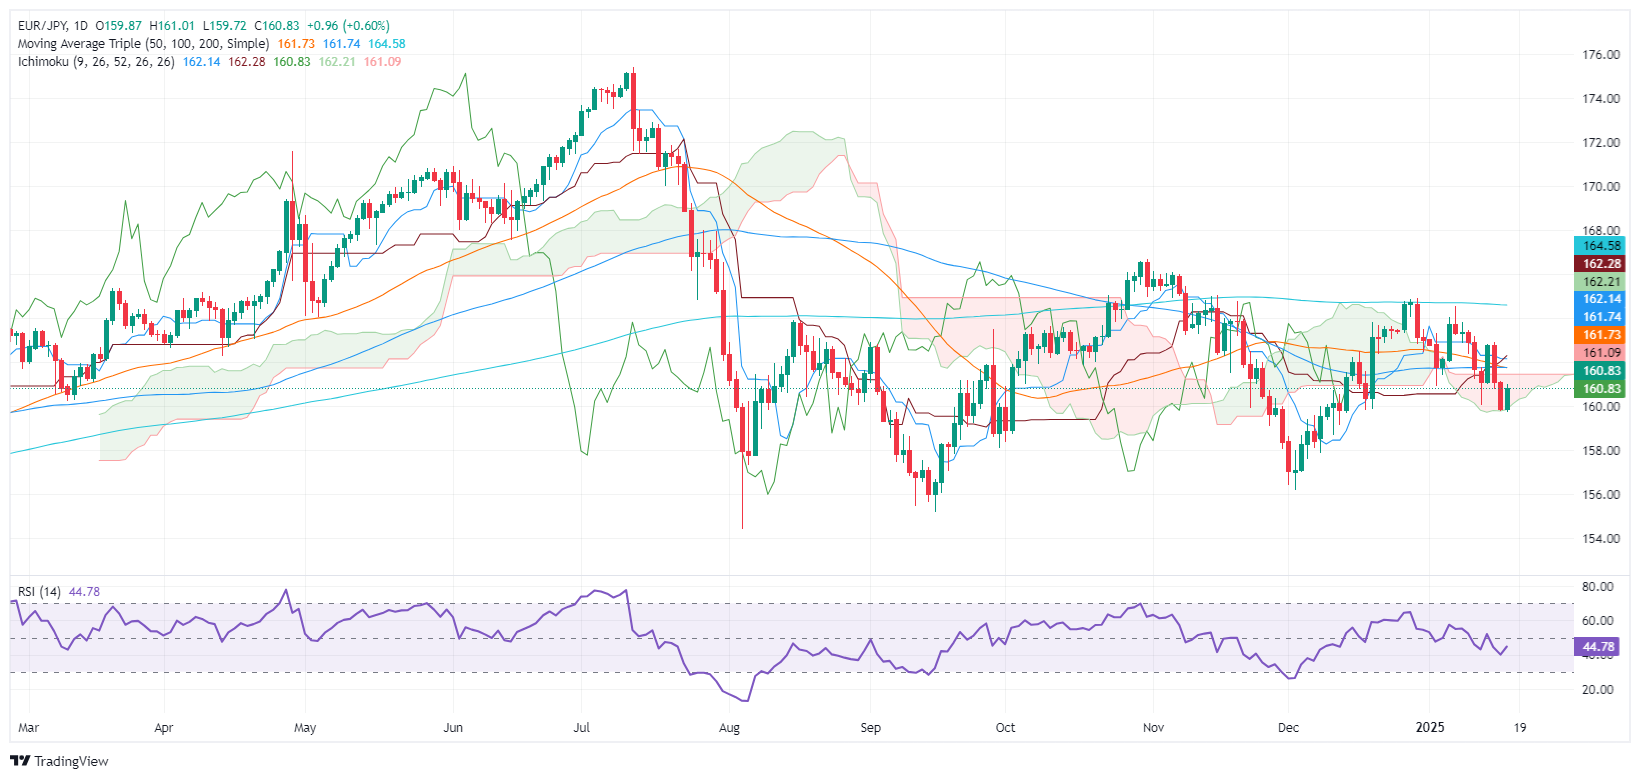
- EUR/JPY finds support at Ichimoku cloud bottom, trading capped at upper edge at 161.45.
- Bearish momentum noted; faces resistance at 161.00 and 50-day SMA at 161.75.
- Decline below Ichimoku cloud could test deeper supports at 156.16 and 154.39.

The EUR/JPY bottomed near 159.69 and rose past 160.50 on Friday after registering two consecutive days of losses as risk appetite deteriorated. At the time of writing, the cross-pair trades at 160.82, up 0.69%.
EUR/JPY Price Forecast: Technical outlook
The EUR/JPY trades sideways, capped on the downside by the Ichimoku cloud (Kumo) near the daily low and peaked at the top of the Kumo at 161.45.
Although momentum is slightly bearish, with the Relative Strength Index (RSI) below its neutral level, sellers must push the EUR/JPG beneath the bottom of the kumo toward 159.00.
A breach of the latter will exacerbate a December 3 swing low test of 156.16. On further weakness, 156.00 is up next, followed by the August 5 swing low of 154.39.
On the upside, the first resistance is 161.00, the top of the range at 161.45, and the 50-day Simple Moving Average (SMA) at 161.75. Once surpassed the next stoup would be the 162.00 mark.
EUR/JPY Price Chart - Daily
Euro PRICE Today
The table below shows the percentage change of Euro (EUR) against listed major currencies today. Euro was the strongest against the Japanese Yen.
| USD | EUR | GBP | JPY | CAD | AUD | NZD | CHF | |
|---|---|---|---|---|---|---|---|---|
| USD | -0.02% | 0.31% | 0.51% | 0.05% | -0.12% | 0.01% | 0.24% | |
| EUR | 0.02% | 0.33% | 0.61% | 0.06% | -0.09% | 0.04% | 0.26% | |
| GBP | -0.31% | -0.33% | 0.27% | -0.26% | -0.41% | -0.29% | -0.07% | |
| JPY | -0.51% | -0.61% | -0.27% | -0.52% | -0.70% | -0.56% | -0.34% | |
| CAD | -0.05% | -0.06% | 0.26% | 0.52% | -0.18% | -0.03% | 0.19% | |
| AUD | 0.12% | 0.09% | 0.41% | 0.70% | 0.18% | 0.14% | 0.35% | |
| NZD | -0.01% | -0.04% | 0.29% | 0.56% | 0.03% | -0.14% | 0.22% | |
| CHF | -0.24% | -0.26% | 0.07% | 0.34% | -0.19% | -0.35% | -0.22% |
The heat map shows percentage changes of major currencies against each other. The base currency is picked from the left column, while the quote currency is picked from the top row. For example, if you pick the Euro from the left column and move along the horizontal line to the US Dollar, the percentage change displayed in the box will represent EUR (base)/USD (quote).
Author

Christian Borjon Valencia
FXStreet
Markets analyst, news editor, and trading instructor with over 14 years of experience across FX, commodities, US equity indices, and global macro markets.

















