EUR/JPY Price Forecast: Hovers around 178.00 after pulling back from record highs
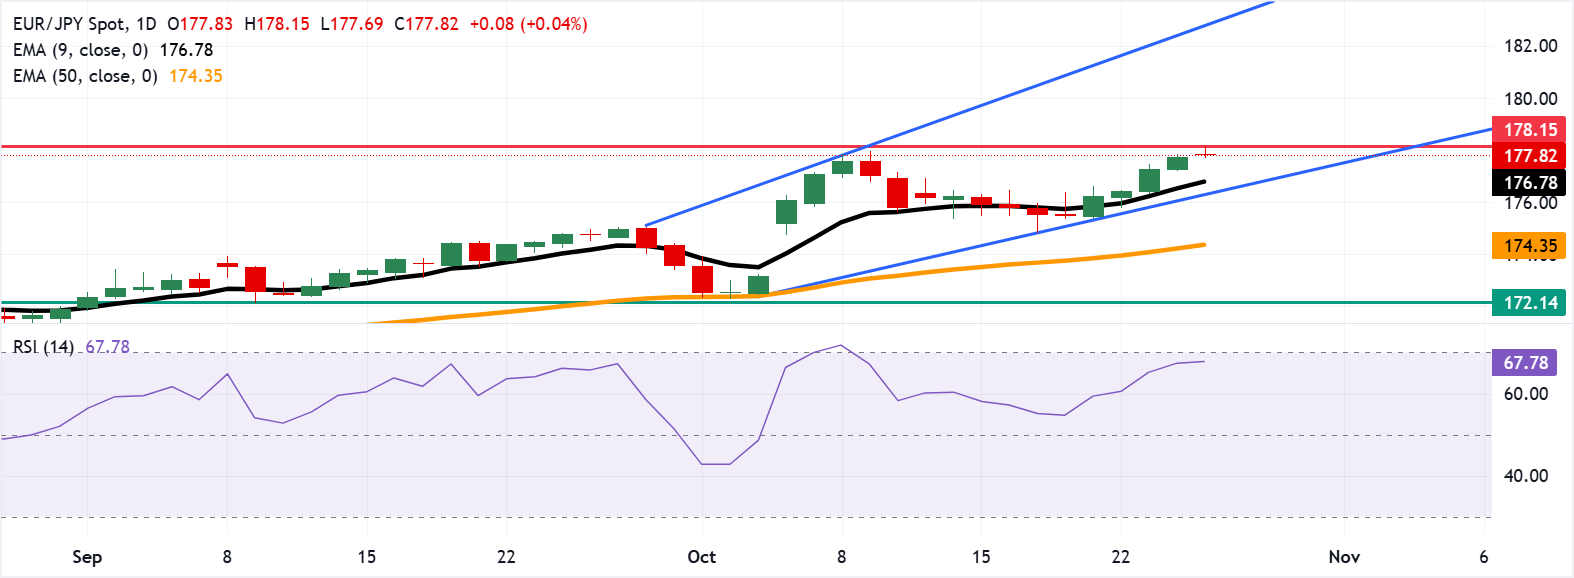
- EUR/JPY has marked a record high of 178.15 on Monday.
- The 14-day Relative Strength Index remains slightly below the 70 level, reinforcing the bullish bias.
- The initial support lies at the nine-day EMA of 176.78.

EUR/JPY halts its four-day winning streak, trading around 177.80 during the European hours on Monday. The technical analysis of the daily chart indicates the prevailing bullish bias as the currency cross remains within the ascending channel pattern.
The short-term price momentum is stronger as the EUR/JPY cross remains above the nine-day Exponential Moving Average (EMA). Additionally, the 14-day Relative Strength Index (RSI) is positioned slightly below the 70 level, reinforcing the bullish bias. A break above the 70 mark would signal overbought conditions.
On the upside, the EUR/JPY cross has reached an all-time high of 178.15, which was recorded on October 27. Further advances would support the currency cross to explore the region around the upper boundary of the ascending channel around 182.90.
The EUR/JPY cross may find its primary support at the nine-day EMA of 176.78, followed by the ascending channel’s lower boundary around 176.40. A break below this confluence support zone would weaken the short-term price momentum and bullish bias, which could put downward pressure on the currency cross to navigate the region around the 50-day EMA at 174.35. Further declines would dampen the medium-term price momentum and prompt the EUR/JPY cross to test the seven-week low of 172.14, which was recorded on September 9.
EUR/JPY: Daily Chart
Euro Price Today
The table below shows the percentage change of Euro (EUR) against listed major currencies today. Euro was the strongest against the Swiss Franc.
| USD | EUR | GBP | JPY | CAD | AUD | NZD | CHF | |
|---|---|---|---|---|---|---|---|---|
| USD | 0.09% | -0.03% | 0.11% | -0.13% | -0.36% | -0.09% | 0.16% | |
| EUR | -0.09% | -0.08% | 0.04% | -0.20% | -0.40% | -0.17% | 0.12% | |
| GBP | 0.03% | 0.08% | 0.14% | -0.11% | -0.30% | -0.09% | 0.20% | |
| JPY | -0.11% | -0.04% | -0.14% | -0.23% | -0.47% | -0.19% | 0.07% | |
| CAD | 0.13% | 0.20% | 0.11% | 0.23% | -0.22% | 0.04% | 0.33% | |
| AUD | 0.36% | 0.40% | 0.30% | 0.47% | 0.22% | 0.23% | 0.53% | |
| NZD | 0.09% | 0.17% | 0.09% | 0.19% | -0.04% | -0.23% | 0.27% | |
| CHF | -0.16% | -0.12% | -0.20% | -0.07% | -0.33% | -0.53% | -0.27% |
The heat map shows percentage changes of major currencies against each other. The base currency is picked from the left column, while the quote currency is picked from the top row. For example, if you pick the Euro from the left column and move along the horizontal line to the US Dollar, the percentage change displayed in the box will represent EUR (base)/USD (quote).
Author

Akhtar Faruqui
FXStreet
Akhtar Faruqui is a Forex Analyst based in New Delhi, India. With a keen eye for market trends and a passion for dissecting complex financial dynamics, he is dedicated to delivering accurate and insightful Forex news and analysis.


