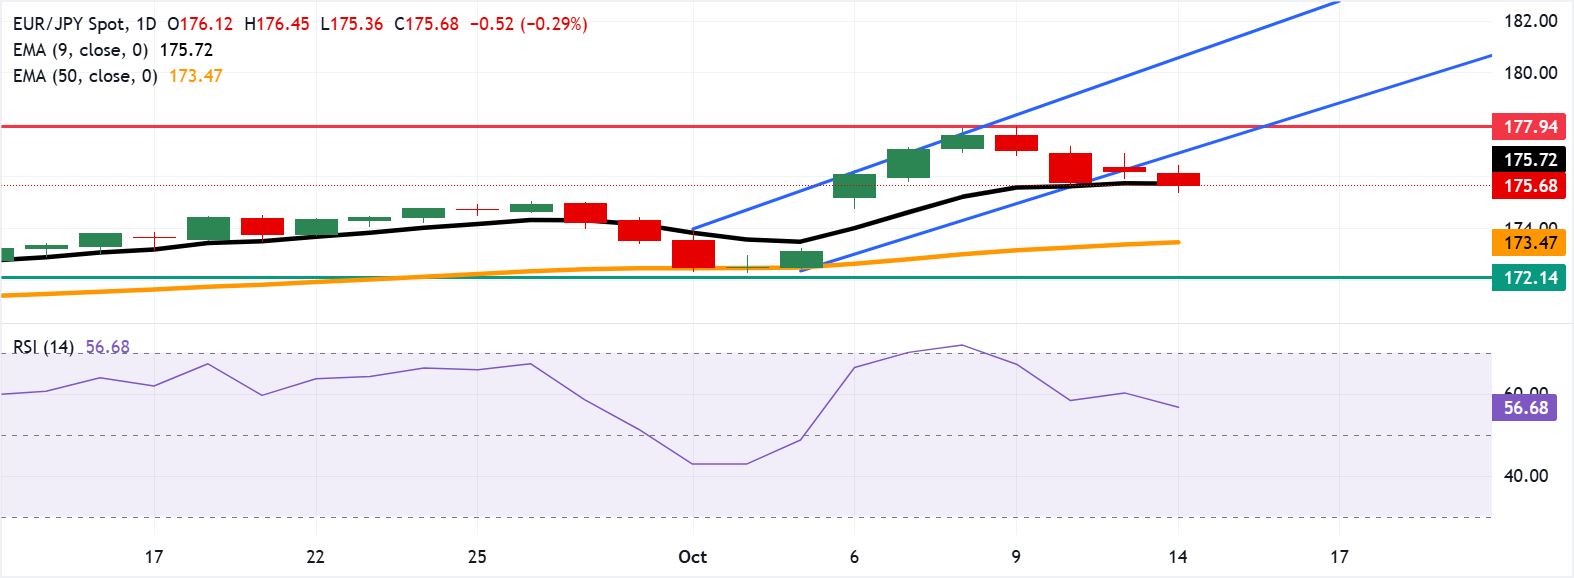
EUR/JPY Price Forecast: Falls to near 175.50 after breaking below nine-day EMA
- EUR/JPY may depreciate toward the 50-day EMA at 173.47.
- The 14-day Relative Strength Index remains above the 50 level, suggesting that bullish bias is still active.
- The immediate resistance lies at the nine-day EMA of 175.72.

EUR/JPY extends its losing streak for the fourth consecutive session, trading around 175.60 during the European hours on Tuesday. The technical analysis of the daily chart indicates a potential for a bearish shift as the currency cross is positioned below the ascending channel pattern.
Additionally, the short-term price momentum is weaker as the EUR/JPY cross has moved below the nine-day Exponential Moving Average (EMA). However, the 14-day Relative Strength Index (RSI) is still positioned above the 50 mark, suggesting that bullish bias is in play. Further movements will likely offer a clear directional trend.
On the downside, the EUR/JPY cross may navigate the region around the 50-day EMA at 173.47. A break below this level would weaken the medium-term price momentum and put downward pressure on the currency cross to test the six-week low of 172.14, which was recorded on September 9.
The EUR/JPY cross may test the immediate barrier at the nine-day EMA of 175.72. A break above the level would improve the short-term price momentum and support the pair to return within the ascending channel. This rebound would revive the bullish bias and lead the currency cross to approach the record high of 177.94, which was recorded on October 9. Further advances would prompt the currency cross to test the upper boundary of the ascending channel around 180.60.
EUR/JPY: Daily Chart
Euro Price Today
The table below shows the percentage change of Euro (EUR) against listed major currencies today. Euro was the weakest against the Japanese Yen.
| USD | EUR | GBP | JPY | CAD | AUD | NZD | CHF | |
|---|---|---|---|---|---|---|---|---|
| USD | 0.12% | 0.46% | -0.17% | 0.18% | 0.93% | 0.65% | -0.05% | |
| EUR | -0.12% | 0.34% | -0.28% | 0.05% | 0.84% | 0.53% | -0.17% | |
| GBP | -0.46% | -0.34% | -0.61% | -0.28% | 0.49% | 0.22% | -0.51% | |
| JPY | 0.17% | 0.28% | 0.61% | 0.35% | 1.07% | 0.77% | 0.07% | |
| CAD | -0.18% | -0.05% | 0.28% | -0.35% | 0.78% | 0.46% | -0.23% | |
| AUD | -0.93% | -0.84% | -0.49% | -1.07% | -0.78% | -0.31% | -1.00% | |
| NZD | -0.65% | -0.53% | -0.22% | -0.77% | -0.46% | 0.31% | -0.69% | |
| CHF | 0.05% | 0.17% | 0.51% | -0.07% | 0.23% | 1.00% | 0.69% |
The heat map shows percentage changes of major currencies against each other. The base currency is picked from the left column, while the quote currency is picked from the top row. For example, if you pick the Euro from the left column and move along the horizontal line to the US Dollar, the percentage change displayed in the box will represent EUR (base)/USD (quote).
Author

Akhtar Faruqui
FXStreet
Akhtar Faruqui is a Forex Analyst based in New Delhi, India. With a keen eye for market trends and a passion for dissecting complex financial dynamics, he is dedicated to delivering accurate and insightful Forex news and analysis.


