• EUR/JPY slips slightly but remains above 170.00, near its highest level since July 2024.
  • Bullish trend intact above Ichimoku Cloud, RSI nears overbought zone.
  • A break above 171.09 would open the path to the psychological resistance at 172.00.
  • A drop below 170.00 could trigger a pullback toward 169.25 or the July swing low at 168.45.

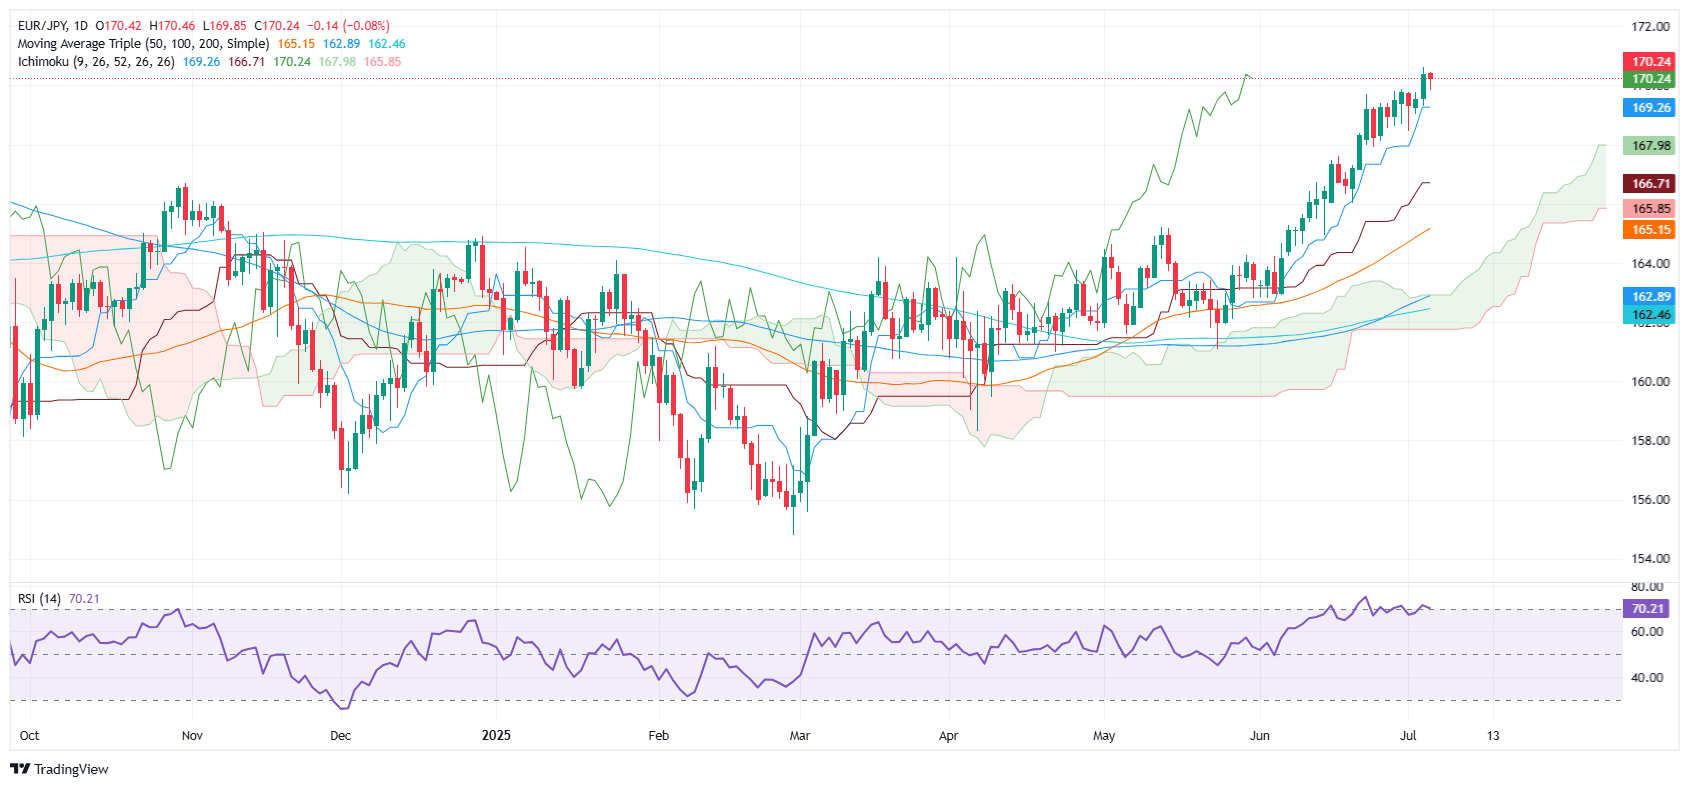
EUR/JPY slips slightly on Friday but remains close to the year-to-date high of 170.61 reached on Thursday. At the time of writing, the cross is trading at 170.19, down 0.11% in the day, amid a risk-off environment as US equity futures tumble amid thin volume trading, with US markets closed for Independence Day.

EUR/JPY Price Forecast: Technical outlook

The upside path is intact, after the Japanese Yen rallied during the first two months of the second half of 2024, sending the EUR/JPY from around 175.42 to 154.39. Since then, the pair enjoyed a recovery, paving the way for higher prices to be tested.

Momentum, although slightly overbought as depicted by the Relative Strength Index (RSI), is bullish. It is worth noting that the EUR/JPY pair has been climbing steadily, after crossing above the Ichimoku Cloud (Kumo) on March 12.

The first key resistance would be the July 23, 2024, daily high at 171.09. A breach of the latter would expose July 19, 2024, high at 171.87, before testing the 172.00 mark. Conversely, if EUR/JPY drops below 170.00, a move towards the Tenkan-sen at 169.25 is likely. Further downside is seen at 168.45, the July 1 swing low.

EUR/JPY Price Chart – Daily

(This story was corrected on July 4 at 16:29 GMT to clarify in the headline, the first bullet point and the first paragraph that the pair didn't reach a year-to-date high on Friday)

Euro PRICE This week

The table below shows the percentage change of Euro (EUR) against listed major currencies this week. Euro was the strongest against the British Pound.

USD EUR GBP JPY CAD AUD NZD CHF
USD -0.40% 0.49% 0.13% -0.60% -0.17% 0.02% -0.64%
EUR 0.40% 0.86% 0.53% -0.21% 0.20% 0.43% -0.25%
GBP -0.49% -0.86% -0.49% -1.05% -0.66% -0.43% -1.10%
JPY -0.13% -0.53% 0.49% -0.74% -0.25% -0.07% -0.72%
CAD 0.60% 0.21% 1.05% 0.74% 0.38% 0.63% -0.04%
AUD 0.17% -0.20% 0.66% 0.25% -0.38% 0.21% -0.44%
NZD -0.02% -0.43% 0.43% 0.07% -0.63% -0.21% -0.66%
CHF 0.64% 0.25% 1.10% 0.72% 0.04% 0.44% 0.66%

The heat map shows percentage changes of major currencies against each other. The base currency is picked from the left column, while the quote currency is picked from the top row. For example, if you pick the Euro from the left column and move along the horizontal line to the US Dollar, the percentage change displayed in the box will represent EUR (base)/USD (quote).

Share: Feed news

Information on these pages contains forward-looking statements that involve risks and uncertainties. Markets and instruments profiled on this page are for informational purposes only and should not in any way come across as a recommendation to buy or sell in these assets. You should do your own thorough research before making any investment decisions. FXStreet does not in any way guarantee that this information is free from mistakes, errors, or material misstatements. It also does not guarantee that this information is of a timely nature. Investing in Open Markets involves a great deal of risk, including the loss of all or a portion of your investment, as well as emotional distress. All risks, losses and costs associated with investing, including total loss of principal, are your responsibility. The views and opinions expressed in this article are those of the authors and do not necessarily reflect the official policy or position of FXStreet nor its advertisers. The author will not be held responsible for information that is found at the end of links posted on this page.

If not otherwise explicitly mentioned in the body of the article, at the time of writing, the author has no position in any stock mentioned in this article and no business relationship with any company mentioned. The author has not received compensation for writing this article, other than from FXStreet.

FXStreet and the author do not provide personalized recommendations. The author makes no representations as to the accuracy, completeness, or suitability of this information. FXStreet and the author will not be liable for any errors, omissions or any losses, injuries or damages arising from this information and its display or use. Errors and omissions excepted.

The author and FXStreet are not registered investment advisors and nothing in this article is intended to be investment advice.

Recommended content


Recommended content

Editors’ Picks

EUR/USD fails to gather traction, remains below 1.1700

EUR/USD fails to gather traction, remains below 1.1700

EUR/USD fails to gather momentum, trading below 1.1700 at the end of the week.  The pair is pulled down by dwindling prospects for an EU-US trade accord, as US President Trump is expected to send a tariff letter to the European Union later today, while the continued demand for the US Dollar also keeps the risk complex under extra pressure.

Meme coins to watch as Bitcoin hits record high

Meme coins to watch as Bitcoin hits record high

Meme coins Bonk, Dogwifhat, and Floki are positioned to extend gains as the weekly recovery reaches crucial resistance levels. The meme coins gain bullish momentum on the back of Bitcoin’s (BTC) recovery run, hitting a new all-time high on Thursday. 

Gold challenges two-week highs near $3,360

Gold challenges two-week highs near $3,360

Gold gains upside impulse at the end of the week, trading near the $3,360 mark per troy ounce in respose to solid demand from te safe-haven space. Persistent trade uncertainty underpins the ongoing risk-off mood among investors, lending extra wings to the precious metal.

GBP/USD drops below 1.3500, flirts with three-week lows

GBP/USD drops below 1.3500, flirts with three-week lows

GBP/USD continues its weekly retracement on Friday, trading at its lowest level in nearly three weeks below the 1.3500 support.  The UK's poor GDP statistics drags on the British pound, while the US Dollar continues to profit from safe-haven flows, sending Cable and its risk-related peers to lower levels.

Week ahead – A storm of CPI data and China’s GDP in focus amid trade uncertainty

Week ahead – A storm of CPI data and China’s GDP in focus amid trade uncertainty

Dollar attracts safe haven flows amid trade anxiety. US inflation data could shake July Fed cut probability. UK, Canadian and Japanese CPI numbers also on tap. Weak Chinese growth may increase calls for more stimulus.

Best Brokers for EUR/USD Trading

Best Brokers for EUR/USD Trading

SPONSORED Discover the top brokers for trading EUR/USD in 2025. Our list features brokers with competitive spreads, fast execution, and powerful platforms. Whether you're a beginner or an expert, find the right partner to navigate the dynamic Forex market.

Forex MAJORS

Cryptocurrencies

Signatures

Best Brokers of 2025