|

EUR/JPY Price Analysis: The next downside target is located at 161.10

  • EUR/JPY trades in negative territory for the fourth consecutive day around 161.85 in Friday’s early European session. 
  • The cross keeps the bearish vibe unchanged below the key EMA; RSI momentum indicator supports the downside. 
  • The immediate resistance level is seen at 162.30; 161.10 acts as an initial support level. 

The EUR/JPY cross remains under some selling pressure below the 162.00 psychological barrier during the early European session on Friday. The growing speculation that the Bank of Japan (BoJ) could remove negative interest rates this month lifts the Japanese Yen (JPY) against the Euro (EUR). At press time, EUR/JPY is trading at 161.85, down 0.16% on the day. 

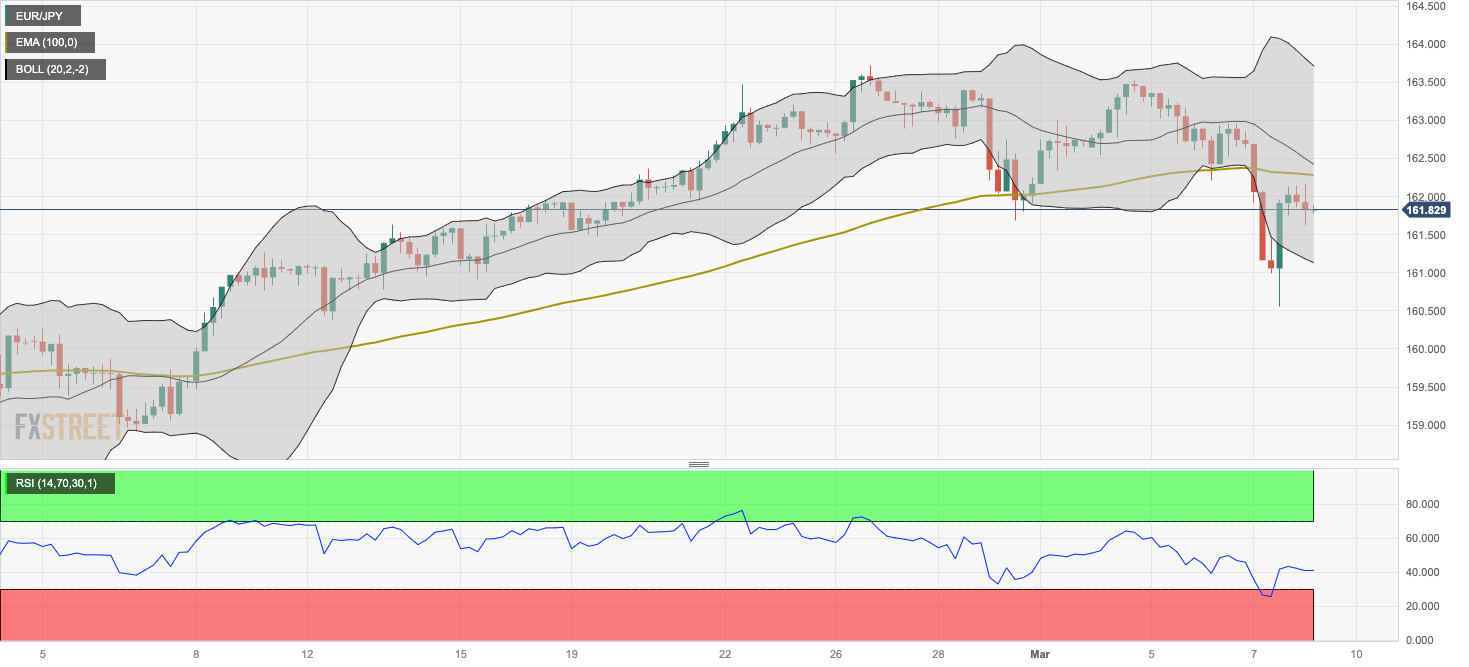
From a technical perspective, EUR/JPY maintains a bearish outlook as the cross holds below the 100-period Exponential Moving Averages (EMA) on the four-hour chart. The downward momentum is supported by the Relative Strength Index (RSI), which lies below the 50-midline, indicating the path of least resistance is to the downside.

The immediate resistance level for EUR/JPY is seen at the 100-period EMA around 162.30. The key hurdle will emerge at the 162.95-163.00 region, representing a high of March 6 and a psychological round figure. Further north, the next upside barrier is located at a high of March 4 at 163.50 and the upper boundary of the Bollinger Band at 163.71. 

On the downside, the lower limit of the Bollinger Band at 161.10 acts as an initial support level for the cross. The additional downside filter to watch is a low of March 7 at 160.55, followed by a psychological round mark at 160.00. 

EUR/JPY four-hour chart

EUR/JPY

Overview
Today last price161.82
Today Daily Change-0.28
Today Daily Change %-0.17
Today daily open162.1
 
Trends
Daily SMA20162.32
Daily SMA50160.49
Daily SMA100160.02
Daily SMA200158.28
 
Levels
Previous Daily High162.85
Previous Daily Low160.56
Previous Weekly High163.72
Previous Weekly Low161.68
Previous Monthly High163.72
Previous Monthly Low158.08
Daily Fibonacci 38.2%161.43
Daily Fibonacci 61.8%161.97
Daily Pivot Point S1160.82
Daily Pivot Point S2159.54
Daily Pivot Point S3158.53
Daily Pivot Point R1163.12
Daily Pivot Point R2164.13
Daily Pivot Point R3165.41

Author

Lallalit Srijandorn

Lallalit Srijandorn is a Parisian at heart. She has lived in France since 2019 and now becomes a digital entrepreneur based in Paris and Bangkok.

More from Lallalit Srijandorn
Share:

Markets move fast. We move first.

Orange Juice Newsletter brings you expert driven insights - not headlines. Every day on your inbox.

By subscribing you agree to our Terms and conditions.

Editor's Picks

EUR/USD stays bid above 1.1700 as risk flows dominate

EUR/USD posts small gains above 1.1700 in early European trading hours on Monday. The US Dollar remains broadly subdued amid a risk-on market profile, underpinning the pair. 

GBP/USD clings to recovery gains near 1.3400

GBP/USD is clinging to recovery gains near 1.3400 in early Europe on Monday. The pair capitalizes on an upbeat market mood and a steady US Dollar as traders digest the recent

 monetary policy decisions by the Fed and the BoE.

Gold hits fresh record highs above $4,400 amid renewed geopolitical woes

Gold is hitting fresh record highs above $4,400 early Monday, helped by renewed geopolitical tensions. Israel-Iran conflict and US-Venezuela headlines drive investors toward the traditional store of value, Gold. 

Bitcoin, Ethereum and Ripple eye breakout for fresh recovery

Bitcoin, Ethereum, and Ripple are approaching key technical levels at the time of writing on Monday as the broader crypto market stabilizes. Market participants are closely watching whether BTC, ETH, and XRP can sustain breakouts and achieve decisive daily closes above nearby resistance levels, which could signal the start of a short-term recovery.

Ten questions that matter going into 2026

2026 may be less about a neat “base case” and more about a regime shift—the market can reprice what matters most (growth, inflation, fiscal, geopolitics, concentration). The biggest trap is false comfort: the same trades can look defensive… right up until they become crowded.

Hyperliquid price forecast: Bullish interest builds amid user recovery

Hyperliquid (HYPE) trades at $25 at press time on Monday, holding the 3% gains from the previous day. The perpetual exchange sees a recovery in active users, while weekly fees collected decline to the lowest level so far this month.