EUR/JPY Price Analysis: The immediate upside barrier is seen near 157.70


  • EUR/JPY loses traction around 156.60, backed by the positive economic outlook from the Japanese government.
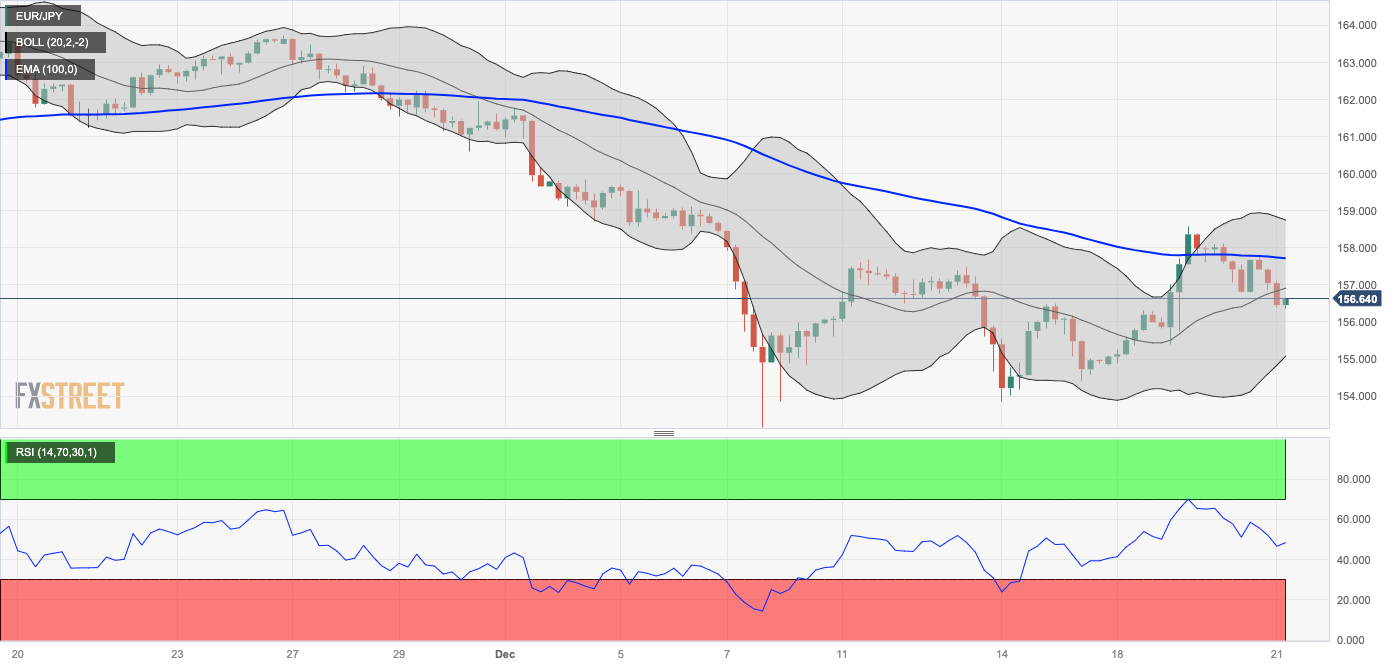
  • The cross maintains the bearish vibe as it holds below the key EMA; RSI indicator stands in bearish territory below 50.
  • The immediate resistance level is seen at 157.71; the initial support level is located at 155.38.

The EUR/JPY cross extends its downside near 156.60 during the early European session on Thursday. That being said, the upward revision of economic growth estimates by the Japanese government lifts the Japanese Yen (JPY) and creates a headwind for the EUR/JPY cross.

From the technical perspective, EUR/JPY keeps the bearish potential intact as the cross holds below the key 100-hour Exponential Moving Averages (EMAs) on the four-hour chart. Additionally, the 14-day Relative Strength Index (RSI) stands in bearish territory below 50, indicating further downside looks favorable.

Any follow-through buying above the 100-hour EMA at 157.71 will see a rally to a high of December 19 at 158.60. The next upside barrier is seen near the upper boundary of the Bollinger Band at 158.75, en route to a high of December 5 at 159.72.

On the flip side, the initial support level for EUR/JPY is located near a low of December 19 at 155.38. The key contention level will emerge near the lower limit of the Bollinger Band and a psychological level at the 155.00–155.05 zone. A breach of this level will see a drop to a low of December 15 at 154.40. The additional downside filter to watch is a low of December 14 at 153.85.

EUR/JPY four-hour chart


EUR/JPY

Overview
Today last price 156.6
Today Daily Change -0.54
Today Daily Change % -0.34
Today daily open 157.14
 
Trends
Daily SMA20 158.74
Daily SMA50 159.68
Daily SMA100 158.76
Daily SMA200 154.52
 
Levels
Previous Daily High 158.13
Previous Daily Low 156.79
Previous Weekly High 157.69
Previous Weekly Low 153.85
Previous Monthly High 164.31
Previous Monthly Low 159.07
Daily Fibonacci 38.2% 157.3
Daily Fibonacci 61.8% 157.62
Daily Pivot Point S1 156.58
Daily Pivot Point S2 156.01
Daily Pivot Point S3 155.24
Daily Pivot Point R1 157.92
Daily Pivot Point R2 158.69
Daily Pivot Point R3 159.26


Share: Feed news

Information on these pages contains forward-looking statements that involve risks and uncertainties. Markets and instruments profiled on this page are for informational purposes only and should not in any way come across as a recommendation to buy or sell in these assets. You should do your own thorough research before making any investment decisions. FXStreet does not in any way guarantee that this information is free from mistakes, errors, or material misstatements. It also does not guarantee that this information is of a timely nature. Investing in Open Markets involves a great deal of risk, including the loss of all or a portion of your investment, as well as emotional distress. All risks, losses and costs associated with investing, including total loss of principal, are your responsibility. The views and opinions expressed in this article are those of the authors and do not necessarily reflect the official policy or position of FXStreet nor its advertisers. The author will not be held responsible for information that is found at the end of links posted on this page.

If not otherwise explicitly mentioned in the body of the article, at the time of writing, the author has no position in any stock mentioned in this article and no business relationship with any company mentioned. The author has not received compensation for writing this article, other than from FXStreet.

FXStreet and the author do not provide personalized recommendations. The author makes no representations as to the accuracy, completeness, or suitability of this information. FXStreet and the author will not be liable for any errors, omissions or any losses, injuries or damages arising from this information and its display or use. Errors and omissions excepted.

The author and FXStreet are not registered investment advisors and nothing in this article is intended to be investment advice.

Recommended content


Recommended content

Editors’ Picks

EUR/USD retreats toward 1.0850 on modest USD recovery

EUR/USD retreats toward 1.0850 on modest USD recovery

EUR/USD stays under modest bearish pressure and trades in negative territory at around 1.0850 after closing modestly lower on Thursday. In the absence of macroeconomic data releases, investors will continue to pay close attention to comments from Federal Reserve officials.

EUR/USD News

GBP/USD holds above 1.2650 following earlier decline

GBP/USD holds above 1.2650 following earlier decline

GBP/USD edges higher after falling to a daily low below 1.2650 in the European session on Friday. The US Dollar holds its ground following the selloff seen after April inflation data and makes it difficult for the pair to extend its rebound. Fed policymakers are scheduled to speak later in the day.

GBP/USD News

Gold climbs to multi-week highs above $2,400

Gold climbs to multi-week highs above $2,400

Gold gathered bullish momentum and touched its highest level in nearly a month above $2,400. Although the benchmark 10-year US yield holds steady at around 4.4%, the cautious market stance supports XAU/USD heading into the weekend.

Gold News

Chainlink social dominance hits six-month peak as LINK extends gains

Chainlink social dominance hits six-month peak as LINK extends gains

Chainlink (LINK) social dominance increased sharply on Friday, exceeding levels seen in the past six months, along with the token’s price rally that started on Wednesday. 

Read more

Week ahead: Flash PMIs, UK and Japan CPIs in focus – RBNZ to hold rates

Week ahead: Flash PMIs, UK and Japan CPIs in focus – RBNZ to hold rates

After cool US CPI, attention shifts to UK and Japanese inflation. Flash PMIs will be watched too amid signs of a rebound in Europe. Fed to stay in the spotlight as plethora of speakers, minutes on tap.

Read more

Forex MAJORS

Cryptocurrencies

Signatures