|

EUR/JPY Price Analysis: Risk-off impulse sent the pair below 145.00

  • A risk-off impulse kept the EUR/JPY from reaching a fresh YTD high at around the 146.00 psychological figure.
  • EUR/JPY’s failure to re-test the 145.63 sent the pair tumbling below the 145.00 mark.
  • Short term, the EUR/JPY might be headed downwards, but upside risks remain once the pair clears 145.00.

The EUR/JPY opens Wednesday’s Asian Pacific session with decent gains of 0.24%, after Tuesday’s 0.34% loss, courtesy of a risk-off impulse when data from the US flashed inflation decelerating less than estimates, fueling possibilities for a US Fed 75 bps rate hike. At the time of writing, the EUR/JPY is trading at 144.41.

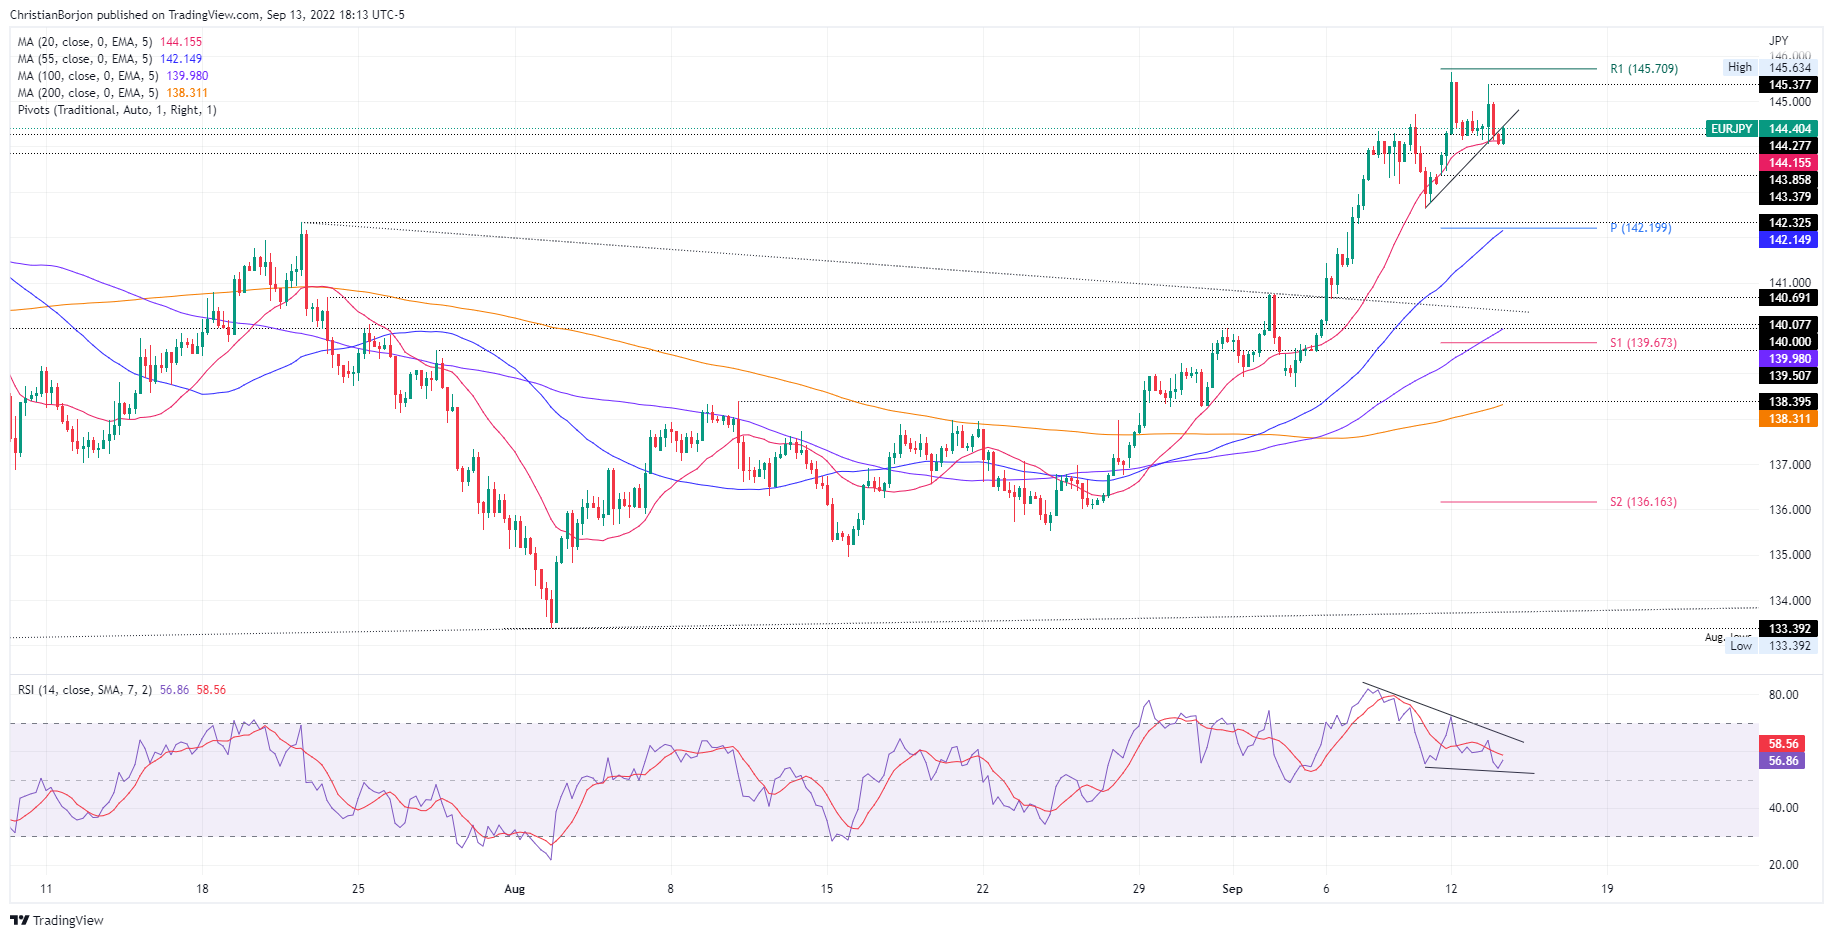
EUR/JPY Price Analysis: Technical outlook

On Tuesday, the EUR/JPY rallied towards the new YTD high reached on Monday at 145.63 but fell short and dived below the 145.00 figure. That, alongside a minimal negative divergence between the EUR/JPY price action and the RSI, could open the door for a fall towards the September 12 daily low at 143.37, ahead of the 143.00 figure.

Short term, the EUR/JPY is neutral-to-downward biased. Even though a negative divergence emerged, EUR/JPY consolidated in the 144.15-145.00 range, with the 20-EMA at 144.15, being the first demand zone, which, once cleared, would pave the way for further losses.

If the above scenario plays out, the EUR/JPY’s next support would be the confluence of the 50-EMA and the daily pivot at around 142.14/19. Break below will expose the 100-EMA at 139.98, ahead of the S1 daily pivot at 139.67.

On the other hand, if the EUR/JPY clears the September 13 high at 145.37, a YTD high re-test is on the cards.

EUR/JPY Key Technical Levels

EUR/JPY

Overview
Today last price144.41
Today Daily Change-0.18
Today Daily Change %-0.12
Today daily open144.61
 
Trends
Daily SMA20139.24
Daily SMA50138.52
Daily SMA100138.69
Daily SMA200134.97
 
Levels
Previous Daily High145.64
Previous Daily Low143.1
Previous Weekly High144.72
Previous Weekly Low138.69
Previous Monthly High139.73
Previous Monthly Low133.4
Daily Fibonacci 38.2%144.67
Daily Fibonacci 61.8%144.07
Daily Pivot Point S1143.26
Daily Pivot Point S2141.92
Daily Pivot Point S3140.73
Daily Pivot Point R1145.8
Daily Pivot Point R2146.98
Daily Pivot Point R3148.33

Author

Christian Borjon Valencia

Markets analyst, news editor, and trading instructor with over 14 years of experience across FX, commodities, US equity indices, and global macro markets.

More from Christian Borjon Valencia
Share:

Editor's Picks

EUR/USD stays well offered below 1.1800

The selling pressure on EUR/USD is picking up pace, with the pair slipping decisively below the key 1.1800 level and sliding to fresh two week lows as Wednesday’s session draws to a close. The move lower comes as the US Dollar finds renewed strength after the latest round of US data and the release of the FOMC Minutes. Next of note on the docket will be the US weekly Initial Jobless Claims.
 

GBP/USD reaches multi-day lows near 1.3500

GBP/USD reverses its initial upside momentum and is now adding to previous declines, approaching the 1.3500 region on Wednesday. Cable’s downtick comes on the back of decent gains in the Greenback and easing UK inflation figures, which seem to have reinforced the case for a BoE rate cut in March.

Gold battle to regain $5,000 continues

Gold is back on the front foot on Wednesday, shaking off part of the early week softness and challenging two-day highs near the $5,000 mark per troy ounce. The move comes ahead of the FOMC Minutes and is unfolding despite an intense rebound in the US Dollar.

Bitcoin has found or is near a bottom, extended consolidation to follow: K33

Bitcoin (BTC) is nearing or has already established a bottom, which could be followed by a sustained period of slow price movement, according to K33.

Mixed UK inflation data no gamechanger for the Bank of England

Food inflation plunged in January, but service sector price pressure is proving stickier. We continue to expect Bank of England rate cuts in March and June. The latest UK inflation read is a mixed bag for the Bank of England, but we doubt it drastically changes the odds of a March rate cut.

Sui extends sideways action ahead of Grayscale’s GSUI ETF launch

Sui is extending its downtrend for the second consecutive day, trading at 0.95 at the time of writing on Wednesday. The Layer-1 token is down over 16% in February and approximately 34% from the start of the year, aligning with the overall bearish sentiment across the crypto market.