|

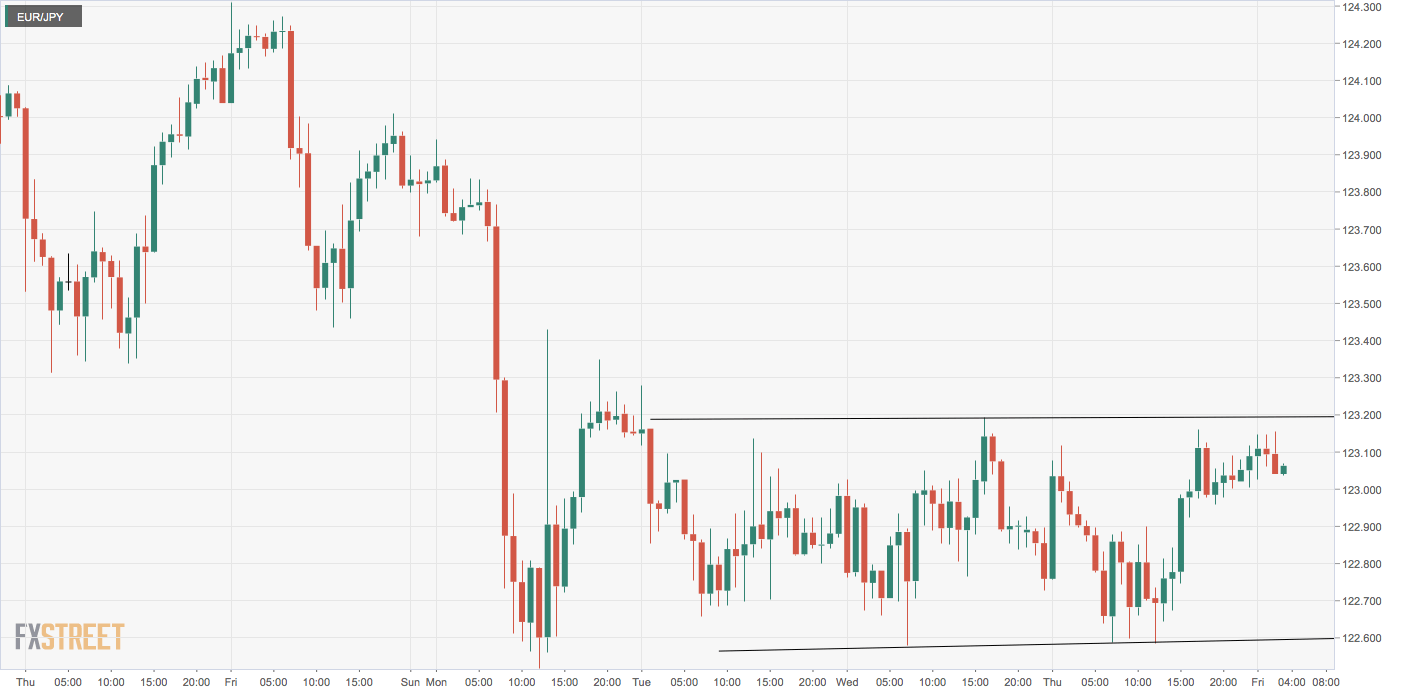
EUR/JPY Price Analysis: Rejected at 123.15, remains stuck in a sideways channel

  • EUR/JPY's hourly chart shows a sideways channel pattern. 
  • A range breakdown would imply a continuation of the sell-off from recent highs near 126.00.

EUR/JPY is trading near 123.05 at press time, representing marginal gains on the day, having faced rejection at 123.15 a few minutes ago. 

The pair has carved out a sideways channel on the hourly chart with the upper end and lower end at 123.20 and 122.57, respectively. 

A breakout would open the doors for 123.83 (target as per the measured move method). However, the bias would remain bearish as long as the pair holds below 124.41 – the former support-turned-resistance of the head-and-shoulders (H&S) breakdown confirmed on Sept. 16. 

Alternatively, a range breakdown, if confirmed, would reinforce the bearish view put forward by the H&S breakdown and expose support at 122.00 (100-week simple moving average). 

Hourly chart

Trend: Bearish below 122.57

Technical levels

EUR/JPY

Overview
Today last price123.05
Today Daily Change0.00
Today Daily Change %0.00
Today daily open123.04
 
Trends
Daily SMA20124.84
Daily SMA50124.77
Daily SMA100122.38
Daily SMA200120.9
 
Levels
Previous Daily High123.16
Previous Daily Low122.58
Previous Weekly High125.9
Previous Weekly Low123.32
Previous Monthly High126.85
Previous Monthly Low123.99
Daily Fibonacci 38.2%122.94
Daily Fibonacci 61.8%122.8
Daily Pivot Point S1122.69
Daily Pivot Point S2122.35
Daily Pivot Point S3122.12
Daily Pivot Point R1123.27
Daily Pivot Point R2123.5
Daily Pivot Point R3123.85

Author

Omkar Godbole

Omkar Godbole

FXStreet Contributor

Omkar Godbole, editor and analyst, joined FXStreet after four years as a research analyst at several Indian brokerage companies.

More from Omkar Godbole
Share:

Editor's Picks

EUR/USD extends losses toward 1.1600 ahead of EU inflation data

EUR/USD extends the decline toward 1.1600 in the European session on Tuesday. The pair remains under pressure as surging energy prices amid the US-Iran war have increased the risks of higher inflation for the Old Continent. The focus is now on the Eurozone preliminary inflation reading for February. 

GBP/USD hovers around 1.3400 with bearish pressure intact

GBP/USD edges higher after three days of losses, trading around 1.3400 during the Asian hours on Tuesday. The technical analysis of the daily chart indicates an ongoing bearish bias, as the pair trades within a descending channel pattern.

Gold weakens below $5,300 as sustained USD buying counter Middle East tensions

Gold attracts some intraday selling and falls around $100 from the daily top, around the $5,380 area. The US Dollar climbs to a fresh high since January 20 and turns  out to be a key factor exerting downward pressure on the commodity. However, concerns about a broader regional conflict in the Middle East continue to weigh on investors' sentiment and underpin demand for the traditional safe-haven bullion.

Stellar risks deeper losses as derivatives metrics turn negative

Stellar is trading red below $0.16 at the time of writing on Tuesday, after a slight recovery the previous day. Weakening derivatives data caps the recovery, while an unfavorable technical outlook projects a deeper correction for the XLM token in the upcoming days.

The market is not panicking it is repricing the probability distribution of Oil and time

At the end of the day, markets do not trade morality or geopolitics. They trade transmission channels. And the only channel that truly matters in this maelstrom runs through the price of energy and the time value of money.

Hyperliquid Price Forecast: HYPE rises on commodities demand amid US-Iran war

Hyperliquid (HYPE) steadies above $33 at press time on Tuesday, marking its fourth consecutive day of recovery in a broadly volatile market due to the ongoing US-Israel strikes on Iran.