|

EUR/JPY Price Analysis: Losses could accelerate to 138.00 near term

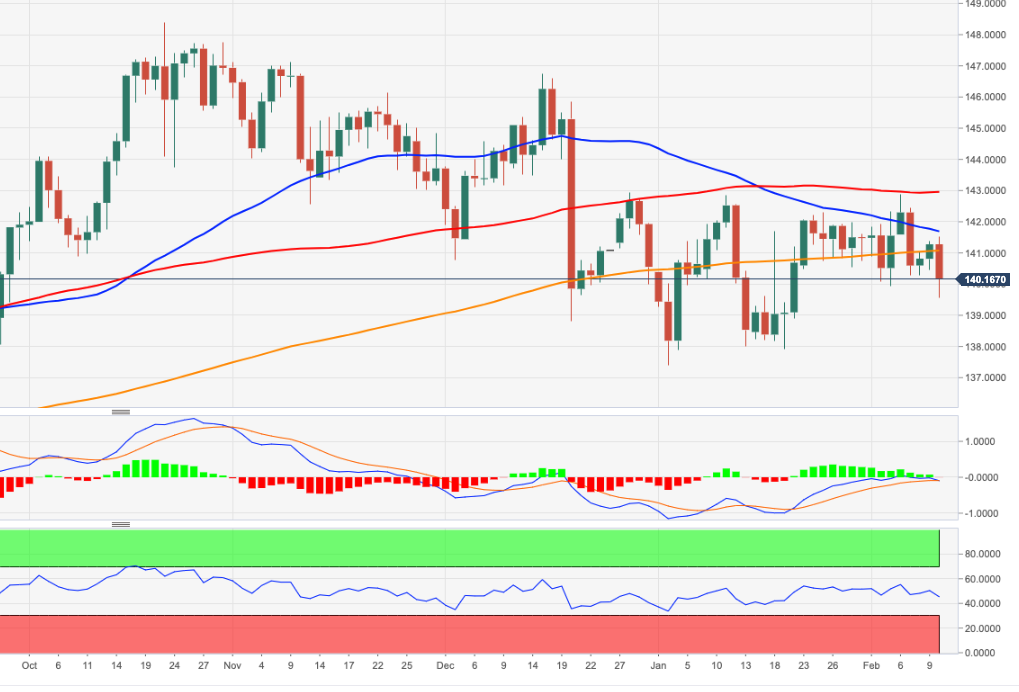
  • EUR/JPY comes under further pressure below the 200-day SMA.
  • The continuation of the downtrend could see the 138.00 region revisited.

EUR/JPY reverses the recent 2-day bounce and drops to 3-week lows in the 139.50 zone at the end of the week.

While the cross is expected to maintain the side-lined theme in the short term, a convincing breakdown of the 200-day SMA at 141.03 should open the taps to extra weakness with the immediate target at the contention zone around 138.00.

In the meantme, below the 200-day SMA, the outlook for the cross is expected to remain bearish.

EUR/JPY daily chart

EUR/JPY

Overview
Today last price140.11
Today Daily Change196
Today Daily Change %-0.83
Today daily open141.28
 
Trends
Daily SMA20140.73
Daily SMA50141.6
Daily SMA100142.94
Daily SMA200141.06
 
Levels
Previous Daily High141.38
Previous Daily Low140.46
Previous Weekly High142.34
Previous Weekly Low139.93
Previous Monthly High142.86
Previous Monthly Low137.39
Daily Fibonacci 38.2%141.02
Daily Fibonacci 61.8%140.81
Daily Pivot Point S1140.7
Daily Pivot Point S2140.12
Daily Pivot Point S3139.78
Daily Pivot Point R1141.61
Daily Pivot Point R2141.95
Daily Pivot Point R3142.53

Author

Pablo Piovano

Born and bred in Argentina, Pablo has been carrying on with his passion for FX markets and trading since his first college years.

More from Pablo Piovano
Share:

Editor's Picks

AUD/USD eyes 0.7150 barrier nine-day EMA

AUD/USD inches higher after registering modest losses in the previous day, trading around 0.7130 during the Asian hours. The technical analysis of the daily chart indicates that the pair is moving sideways within the rectangle pattern, suggesting a consolidation as neither the bulls nor the bears have enough momentum to take control of the market.

USD/JPY trades below 160.00 intervention threshold; bullish bias intact

The USD/JPY pair attracts some sellers during the Asian session amid fears that authorities will step in again to prop up the Japanese Yen. Furthermore, the Israel-Lebanon truce prompts some profit-taking around the US Dollar and exerts downward pressure on the currency pair.

Gold defends 200-day SMA at $4,425, but for how long?

Gold is attempting a tepid recovery toward $4,500 early Thursday, as renewed optimism in the Mideast geopolitical front calms market nerves. This cautious optimism across Asian markets weighs on Oil prices, and diminishes the US Dollar’s safe-haven appeal, helping Gold stage a decent comeback from the weekly low of $4,424.


Hyperliquid: ETF demand, capital rotation fuel HYPE rally as Bitcoin melts

Hyperliquid price sustains an upward trend near its all-time high of $75.76 on Thursday after posting 80% gains in May, while Bitcoin (BTC) retraces below $65,000, triggering a market-wide panic.

Kevin Warsh takes the Fed helm: What it means for the US Dollar
The Federal Reserve moves away from the highly predictable "forward guidance" model of the Jerome Powell era to a new “Kevin Warsh environment”, characterized by less communication, more policy surprises, and an increased focus on the Fed's complex balance sheet.
Recession on paper: What really moves the Canadian Loonie now?

Statistics Canada handed the headline writers a gift and the analysts a headache. Real GDP shrank 0.1% on an annualized basis in the first quarter, and with the fourth quarter of 2025 revised down to a 1.0% contraction, that is two negative quarters in a row, the textbook definition of a technical recession and Canada's first since the pandemic.