|

EUR/JPY Price Analysis: Head-and-shoulders chart pattern emerges, targets the 143.00 area

  • EUR/JPY breaks below the two-week support trendline, confirming a head-and-shoulders chart pattern.
  • The pair faces multiple support levels to target 143.20, including 50-day EMA at 146.00 and 100-day EMA at 144.59.
  • Reclaiming 147.00 could open the door for gains and negate the bearish chart pattern, with the next resistance at 147.80-148.00.

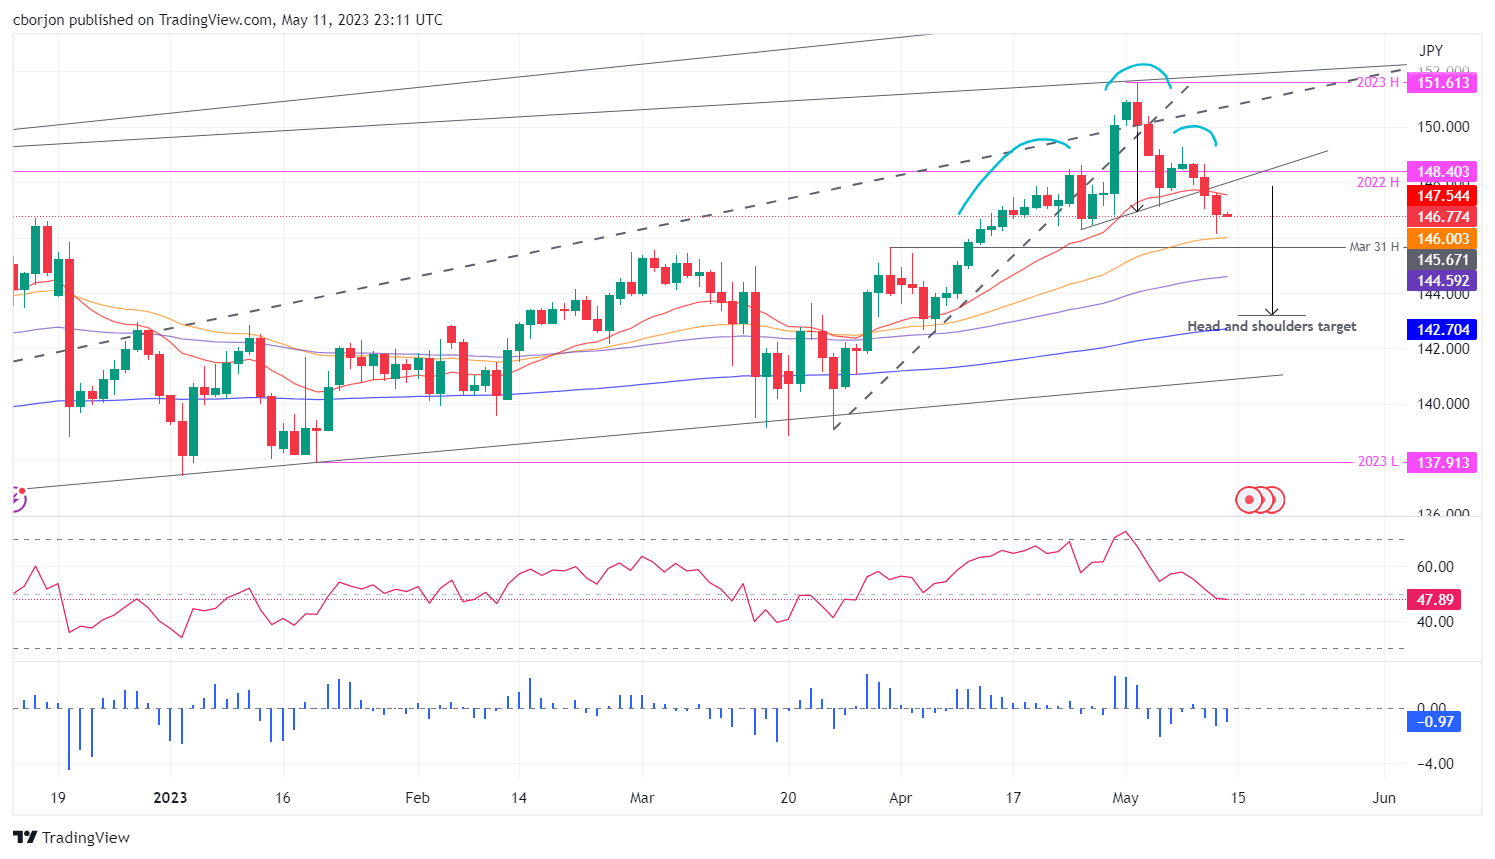
EUR/JPY confirms a break below a two-week support trendline, which also ensures the formation of a head-and-shoulders chart pattern that targets a drop of 450 pips toward 143.20, 50 pips shy of piercing the 200-day Exponential Moving Average (EMA) at 142.70. However, it should be said that it would need to hurdle support levels on its way south. As the Asian session begins, the EUR/JPY is trading at 146.85, down by 0.01%, after losing 0.46% on Thursday.

EUR/JPY Price Analysis: Technical outlook

Given the backdrop, the GBP/JPY confirmed the formation of a head-and-shoulders chart pattern. Even though it is a bearish chart pattern, sellers must reclaim several demand areas on its way toward the 143.00 figure.

The EUR/JPY first support would be the 50-day Exponential Moving Average (EMA) at 146.00. A breach of the latter would sponsor a fall to the 100-day EMA at 144.59 before testing the 144.00 psychological level. Once cleared, the head-and-shoulders profit target of 143.20 should be reached.

The Relative Strength Index (RSI) indicator turned bearish, warranting that further downside is expected, while the 3-day Rate of Change (RoC), continues to slide below its neutral level.

Conversely, if EUR/JPY buyers reclaim 147.00, that could open the door for further gains. The next supply area to test would be the head-and-shoulders neckline at around 147.80-148.00, before reaching towards the last year’s high of 148.40, negating the bearish chart pattern.

Trend: Downward biased.

EUR/JPY Price Action – Daily Chart

EUR/JPY Daily chart

EUR/JPY

Overview
Today last price146.85
Today Daily Change-0.71
Today Daily Change %-0.48
Today daily open147.56
 
Trends
Daily SMA20148.06
Daily SMA50145.31
Daily SMA100143.41
Daily SMA200142.94
 
Levels
Previous Daily High148.67
Previous Daily Low147.04
Previous Weekly High151.62
Previous Weekly Low147.13
Previous Monthly High150.44
Previous Monthly Low142.55
Daily Fibonacci 38.2%147.66
Daily Fibonacci 61.8%148.05
Daily Pivot Point S1146.84
Daily Pivot Point S2146.13
Daily Pivot Point S3145.22
Daily Pivot Point R1148.47
Daily Pivot Point R2149.38
Daily Pivot Point R3150.1
 

Author

Christian Borjon Valencia

Christian Borjon began his career as a retail trader in 2010, mainly focused on technical analysis and strategies around it. He started as a swing trader, as he used to work in another industry unrelated to the financial markets.

More from Christian Borjon Valencia
Share:

Markets move fast. We move first.

Orange Juice Newsletter brings you expert driven insights - not headlines. Every day on your inbox.

By subscribing you agree to our Terms and conditions.

Editor's Picks

EUR/USD moves sideways below 1.1800 on Christmas Eve

EUR/USD struggles to find direction and trades in a narrow channel below 1.1800 after posting gains for two consecutive days. Bond and stock markets in the US will open at the usual time and close early on Christmas Eve, allowing the trading action to remain subdued. 

GBP/USD keeps range around 1.3500 amid quiet markets

GBP/USD keeps its range trade intact at around 1.3500 on Wednesday. The Pound Sterling holds the upper hand over the US Dollar amid pre-Christmas light trading as traders move to the sidelines heading into the holiday season. 

Gold retreats from record highs, trades below $4,500

Gold retreats after setting a new record-high above $4,520 earlier in the day and trades in a tight range below $4,500 as trading volumes thin out ahead of the Christmas break. The US Dollar selling bias remains unabated on the back of dovish Fed expectations, which continues to act as a tailwind for the bullion amid persistent geopolitical risks.

Bitcoin slips below $87,000 as ETF outflows intensify, whale participation declines

Bitcoin price continues to trade around $86,770 on Wednesday, after failing to break above the $90,000 resistance. US-listed spot ETFs record an outflow of $188.64 million on Tuesday, marking the fourth consecutive day of withdrawals.

Economic outlook 2026-2027 in advanced countries: Solidity test

After a year marked by global economic resilience and ending on a note of optimism, 2026 looks promising and could be a year of solid economic performance. In our baseline scenario, we expect most of the supportive factors at work in 2025 to continue to play a role in 2026.

Avalanche struggles near $12 as Grayscale files updated form for ETF

Avalanche trades close to $12 by press time on Wednesday, extending the nearly 2% drop from the previous day. Grayscale filed an updated form to convert its Avalanche-focused Trust into an ETF with the US Securities and Exchange Commission.