|

EUR/JPY Price Analysis: Extends losses to two days, diving below 158.00

  • EUR/JPY slips amid a risk-on mood, as it remains below the Ichimoku Cloud
  • Further downside is seen below the Tenkan and Kijun Sen levels as the pair aims toward 156.00.
  • The EUR/JPY could shift bullish if buyers reclaim 159.00.

The EUR/JPY begins the week on a lower note, posting losses of 0.17% on Monday amid a risk-on impulse. The cross-currency pair's upward move was quickly rejected at a multi-month support trendline turned resistance, opening the door for a pullback. Therefore, the pair is trading at 157.92 as Tuesday’s Asian session begins, almost flat.

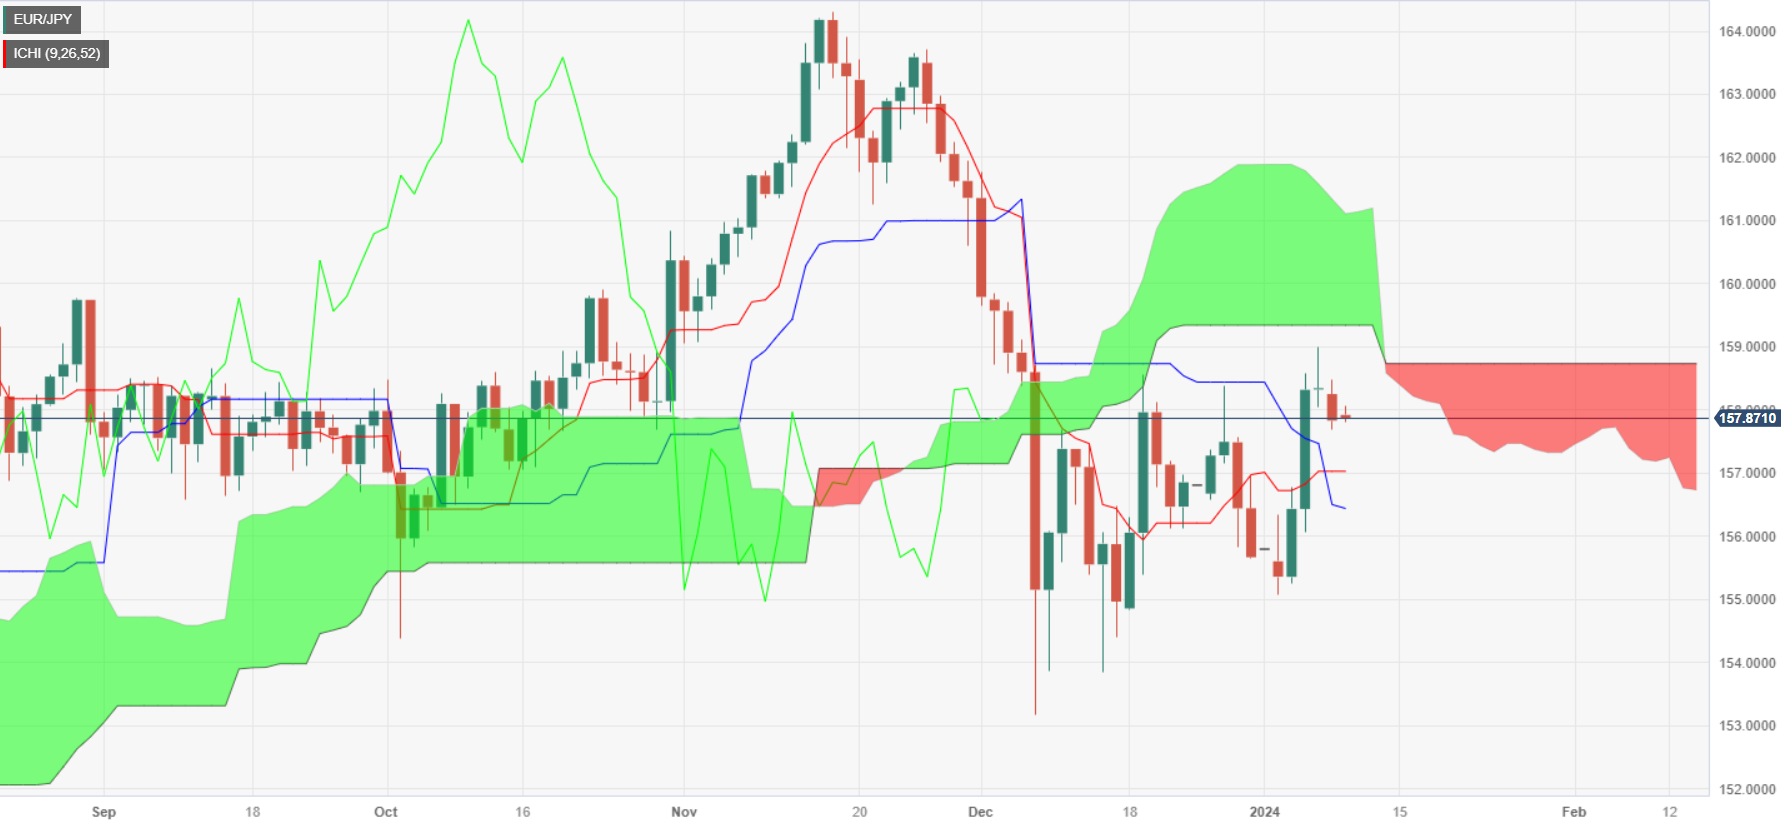
The cross-pair base shifted bearish after diving below the Ichimoku Cloud (Kumo). That along with the cross of the Tenkan-Sen below the Kijun-Sen, has kept the EUR/JPY capped below the 159.00 figure. If sellers would like to extend the downtrend, they must drag prices below the Tenkan-Sen at 157.03, followed by the Kijun-Sen at 156.48, as the pair extends its losses toward 156.00.

On the other hand, if the EUR/JPY reverses its course and achieves a daily close above 158.50, that could open the door for a test of 159.00. On further strength, the pair would aim towards the bottom of the Kumo at 159.30, ahead of challenging 160.00.

EUR/JPY Price Action – Daily Chart

EUR/JPY Technical Levels

EUR/JPY

Overview
Today last price157.95
Today Daily Change-0.40
Today Daily Change %-0.25
Today daily open158.35
 
Trends
Daily SMA20156.67
Daily SMA50159.3
Daily SMA100158.62
Daily SMA200155.38
 
Levels
Previous Daily High159
Previous Daily Low158.05
Previous Weekly High159
Previous Weekly Low155.07
Previous Monthly High161.78
Previous Monthly Low153.17
Daily Fibonacci 38.2%158.64
Daily Fibonacci 61.8%158.41
Daily Pivot Point S1157.93
Daily Pivot Point S2157.52
Daily Pivot Point S3156.99
Daily Pivot Point R1158.88
Daily Pivot Point R2159.41
Daily Pivot Point R3159.83

Author

Christian Borjon Valencia

Markets analyst, news editor, and trading instructor with over 14 years of experience across FX, commodities, US equity indices, and global macro markets.

More from Christian Borjon Valencia
Share:

Editor's Picks

AUD/USD eyes 0.7150 barrier nine-day EMA

AUD/USD inches higher after registering modest losses in the previous day, trading around 0.7130 during the Asian hours. The technical analysis of the daily chart indicates that the pair is moving sideways within the rectangle pattern, suggesting a consolidation as neither the bulls nor the bears have enough momentum to take control of the market.

USD/JPY trades below 160.00 intervention threshold; bullish bias intact

The USD/JPY pair attracts some sellers during the Asian session amid fears that authorities will step in again to prop up the Japanese Yen. Furthermore, the Israel-Lebanon truce prompts some profit-taking around the US Dollar and exerts downward pressure on the currency pair.

Gold rebounds from one-week low as Israel-Lebanon truce pressures safe-haven USD

Gold gains some positive traction on Thursday and climbs to the $4,475 area during the Asian session, reversing a major part of the previous day's slide to a one-week low. The Israel-Lebanon truce prompts some profit-taking around the US Dollar and supports the commodity. 


Hyperliquid: ETF demand, capital rotation fuel HYPE rally as Bitcoin melts

Hyperliquid price sustains an upward trend near its all-time high of $75.76 on Thursday after posting 80% gains in May, while Bitcoin (BTC) retraces below $65,000, triggering a market-wide panic.

Kevin Warsh takes the Fed helm: What it means for the US Dollar
The Federal Reserve moves away from the highly predictable "forward guidance" model of the Jerome Powell era to a new “Kevin Warsh environment”, characterized by less communication, more policy surprises, and an increased focus on the Fed's complex balance sheet.
Recession on paper: What really moves the Canadian Loonie now?

Statistics Canada handed the headline writers a gift and the analysts a headache. Real GDP shrank 0.1% on an annualized basis in the first quarter, and with the fourth quarter of 2025 revised down to a 1.0% contraction, that is two negative quarters in a row, the textbook definition of a technical recession and Canada's first since the pandemic.