|

EUR/JPY Price Analysis: Extends its upside above 166.50 amid the overbought condition

  • EUR/JPY gains traction near 166.85 on Thursday, the highest level since 2008. 
  • The cross keeps the bullish vibe, with the overbought RSI condition.
  • The first resistance level will emerge at 166.82; the initial support level is located at 165.35.

The EUR/JPY cross trades in positive territory for the fifth consecutive day during the early European trading hours on Thursday. The cross edges higher to 166.85, its highest level since 2008. The Tokyo April Consumer Price Index (CPI) will be due on Friday ahead of the Bank of Japan (BoJ) interest rate decision. The markets expect the Japanese central bank to leave its policy rate and bond purchase amounts unchanged since BoJ raised interest rates in March for the first time since 2007. The divergence in rates between Japan and the Eurozone is the key factor that weighs the Japanese Yen (JPY) against the Euro (EUR). 

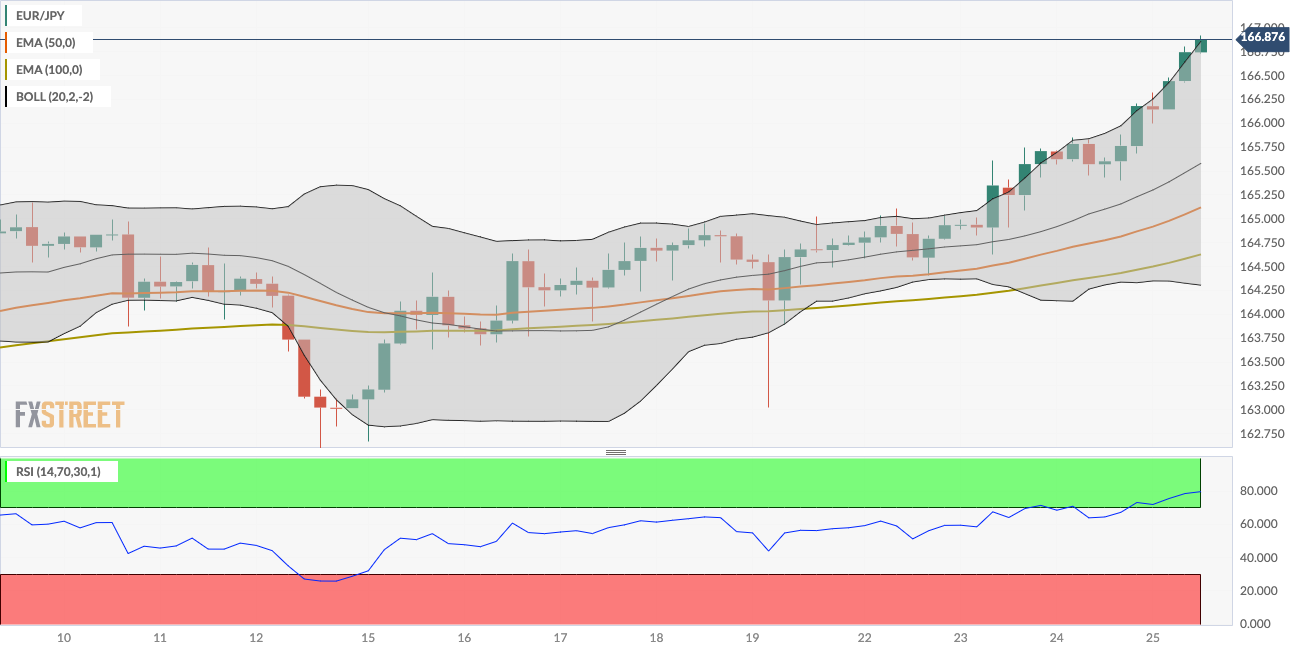
Technically, EUR/JPY maintains the bullish stance unchanged on the four-hour chart as the cross is above the 50-period and 100-period Exponential Moving Averages (EMA) with an upward slope. The Relative Strength Index (RSI) holds in bullish territory above 70. However, the overbought RSI condition indicates that further consolidation cannot be ruled out before positioning for any near-term EUR/JPY appreciation.

The first upside barrier for the cross will emerge near the upper boundary of the Bollinger Band at 166.82. The next hurdle is seen at the 167.00 psychological level. A bullish breakout above this level will see a rally to a yearly high of 2007 at 168.95, en route to an all-time high of 169.78 in July 2008.

On the flip side, the initial support level for the cross is located near a high of March 20 at 165.35. Further south, the next contention level to watch is the 50-period EMA at 165.11, followed by the 100-period EMA at 164.62. A breach of this level will see a drop to the lower limit of the Bollinger Band at 164.30.  

EUR/JPY four-hour chart
EUR/JPY

Overview
Today last price166.87
Today Daily Change0.67
Today Daily Change %0.40
Today daily open166.2
 
Trends
Daily SMA20164.31
Daily SMA50163.35
Daily SMA100160.95
Daily SMA200159.84
 
Levels
Previous Daily High166.23
Previous Daily Low165.4
Previous Weekly High165.03
Previous Weekly Low162.67
Previous Monthly High165.36
Previous Monthly Low160.22
Daily Fibonacci 38.2%165.91
Daily Fibonacci 61.8%165.72
Daily Pivot Point S1165.65
Daily Pivot Point S2165.11
Daily Pivot Point S3164.82
Daily Pivot Point R1166.49
Daily Pivot Point R2166.78
Daily Pivot Point R3167.32

Author

Lallalit Srijandorn

Lallalit Srijandorn is a Parisian at heart. She has lived in France since 2019 and now becomes a digital entrepreneur based in Paris and Bangkok.


More from Lallalit Srijandorn
Share:

Editor's Picks

GBP/USD dips below 1.3350 as USD demand surges

GBP/USD extends its intraday slide and struggles around 1.3350 early in the American session on Thursday. The pair's upside remains capped by a US Dollar bounce and cooler-than-expected UK inflation data amid escalating Middle East tensions.

EUR/USD falls below 1.1400 post ECB decision

The US Dollar gains momentum on Thursday as Middle East concerns fuel demand for safety. The Euro, in the meantime, came under selling pressure following the ECB monetary policy decision. EUR/USD down to fresh weekly lows around 1.1380.

Gold slides further below $4,100 as fears lead

Gold keeps retreating on Thursday, trading well below $4,100 early in the American session. US crude oil prices climb to a fresh six-week high toward $90 amid a further escalation of tensions between the US and Iran, fueling inflation fears and bolstering US Fed interest rate hike expectations. Hawkish Fed bets weigh negatively on the yieldless bullion.

Hyperliquid, Robinhood could lead crypto’s next bull market as DeFi and TradFi converge

The next crypto bull market could be driven by the growing convergence between blockchain-based financial infrastructure and traditional finance, according to Bitwise CIO Matt Hougan. In a report published late Tuesday, Hougan argued that crypto may be showing early signs of a market bottom, with Bitcoin gaining 9% since July 1 even as the NASDAQ 100 declined 6%.

Bitcoin falls as surging Oil prices revive inflation concerns

Bitcoin extends its correction, trading below $65,800 after a modest decline in the previous day. Despite BTC’s fading strength, US-listed spot Bitcoin Exchange Traded Funds continued to attract institutional inflows on Wednesday, marking the seventh consecutive day of gains.

US Dollar mid-year outlook: Exceptional currency, exceptional risks?
The US Dollar enters the second half of 2026 in a markedly different position from a year ago. The King currency has recovered, reflecting persistent US inflation, changing expectations for Fed policy, geopolitical tensions and renewed demand for defensive assets.















